Performance of Physical Gold vs Stocks during Equity Market Declines
Performance of Physical Gold vs Stocks during Equity Market Declines | Chart of the Week You can see in this performance of physical gold vs stocks during equity market declines…
Performance of Physical Gold vs Stocks during Equity Market Declines | Chart of the Week You can see in this performance of physical gold vs stocks during equity market declines…
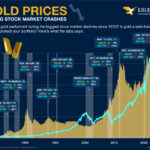
Gold Prices During Stock Market Crashes | Chart of the Week Gold has traditionally been considered the ultimate "safe-haven asset," offering protection to investors in times of stock market turmoil.…
The Worse The Bear Market, The Better for Gold The comments below are an edited and abridged synopsis of an article by Jordan Roy-Byrne Many in the gold community fear…
Biggest S&P 500 Declines vs Gold | Chart of the Week In this chart, you can see that the first case was in 1976, where the S&P lost 19% and…
Why Nobody Is Safe from The Looming Market Crash The comments below are an edited and abridged synopsis of an article by David Morgan A stock market pullback: Is it…
There is No Way This Bull Market Doesn’t End Very Badly! The comments below are an edited and abridged synopsis of an article by Lance Roberts “There is no way…
Stock Market Leverage Spikes in Historic Manner: Another WTF Chart of A Zoo That Has Gone Nuts The comments below are an edited and abridged synopsis of an article by…
Fed Warns Stocks Face ‘Significant Declines’ if Pandemic Worsens The comments below are an edited and abridged synopsis of an article by Tyler Durden When equities closed last week after…
Increased Pension Liabilities During the Coming Market Crash To download PDF version Many Canadian companies have significant unfunded pension liabilities on their balance sheets. With the traditional 60/40 allocation to…
Two-Thirds of Top Primary Silver Miners Suffered Production Declines in 2017 The comments above & below is an edited and abridged synopsis of an article by Steve St. Angelo Two-thirds…