Biggest S&P 500 Declines vs Gold | Chart of the Week
In this chart, you can see that the first case was in 1976, where the S&P lost 19% and gold went to 53%. Similarly, in the recent market crash, S&P declined 56%, while gold increased by 25%. These two charts show the last two corrections to the tech bubble in 2002, a real estate bubble 2007.
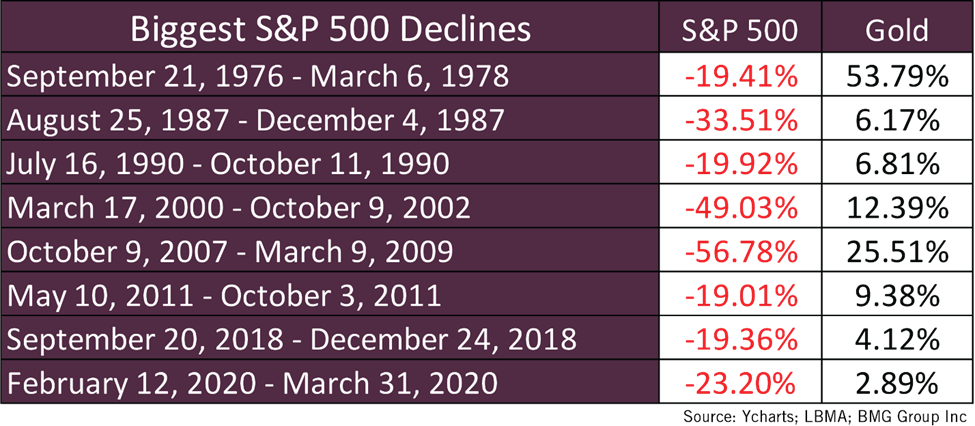
Source: Ycharts; LBMA; BMG Group Inc.
Pingback: The Worse The Bear Market, The Better for Gold – BMG