Performance of Physical Gold vs Stocks during Equity Market Declines | Chart of the Week
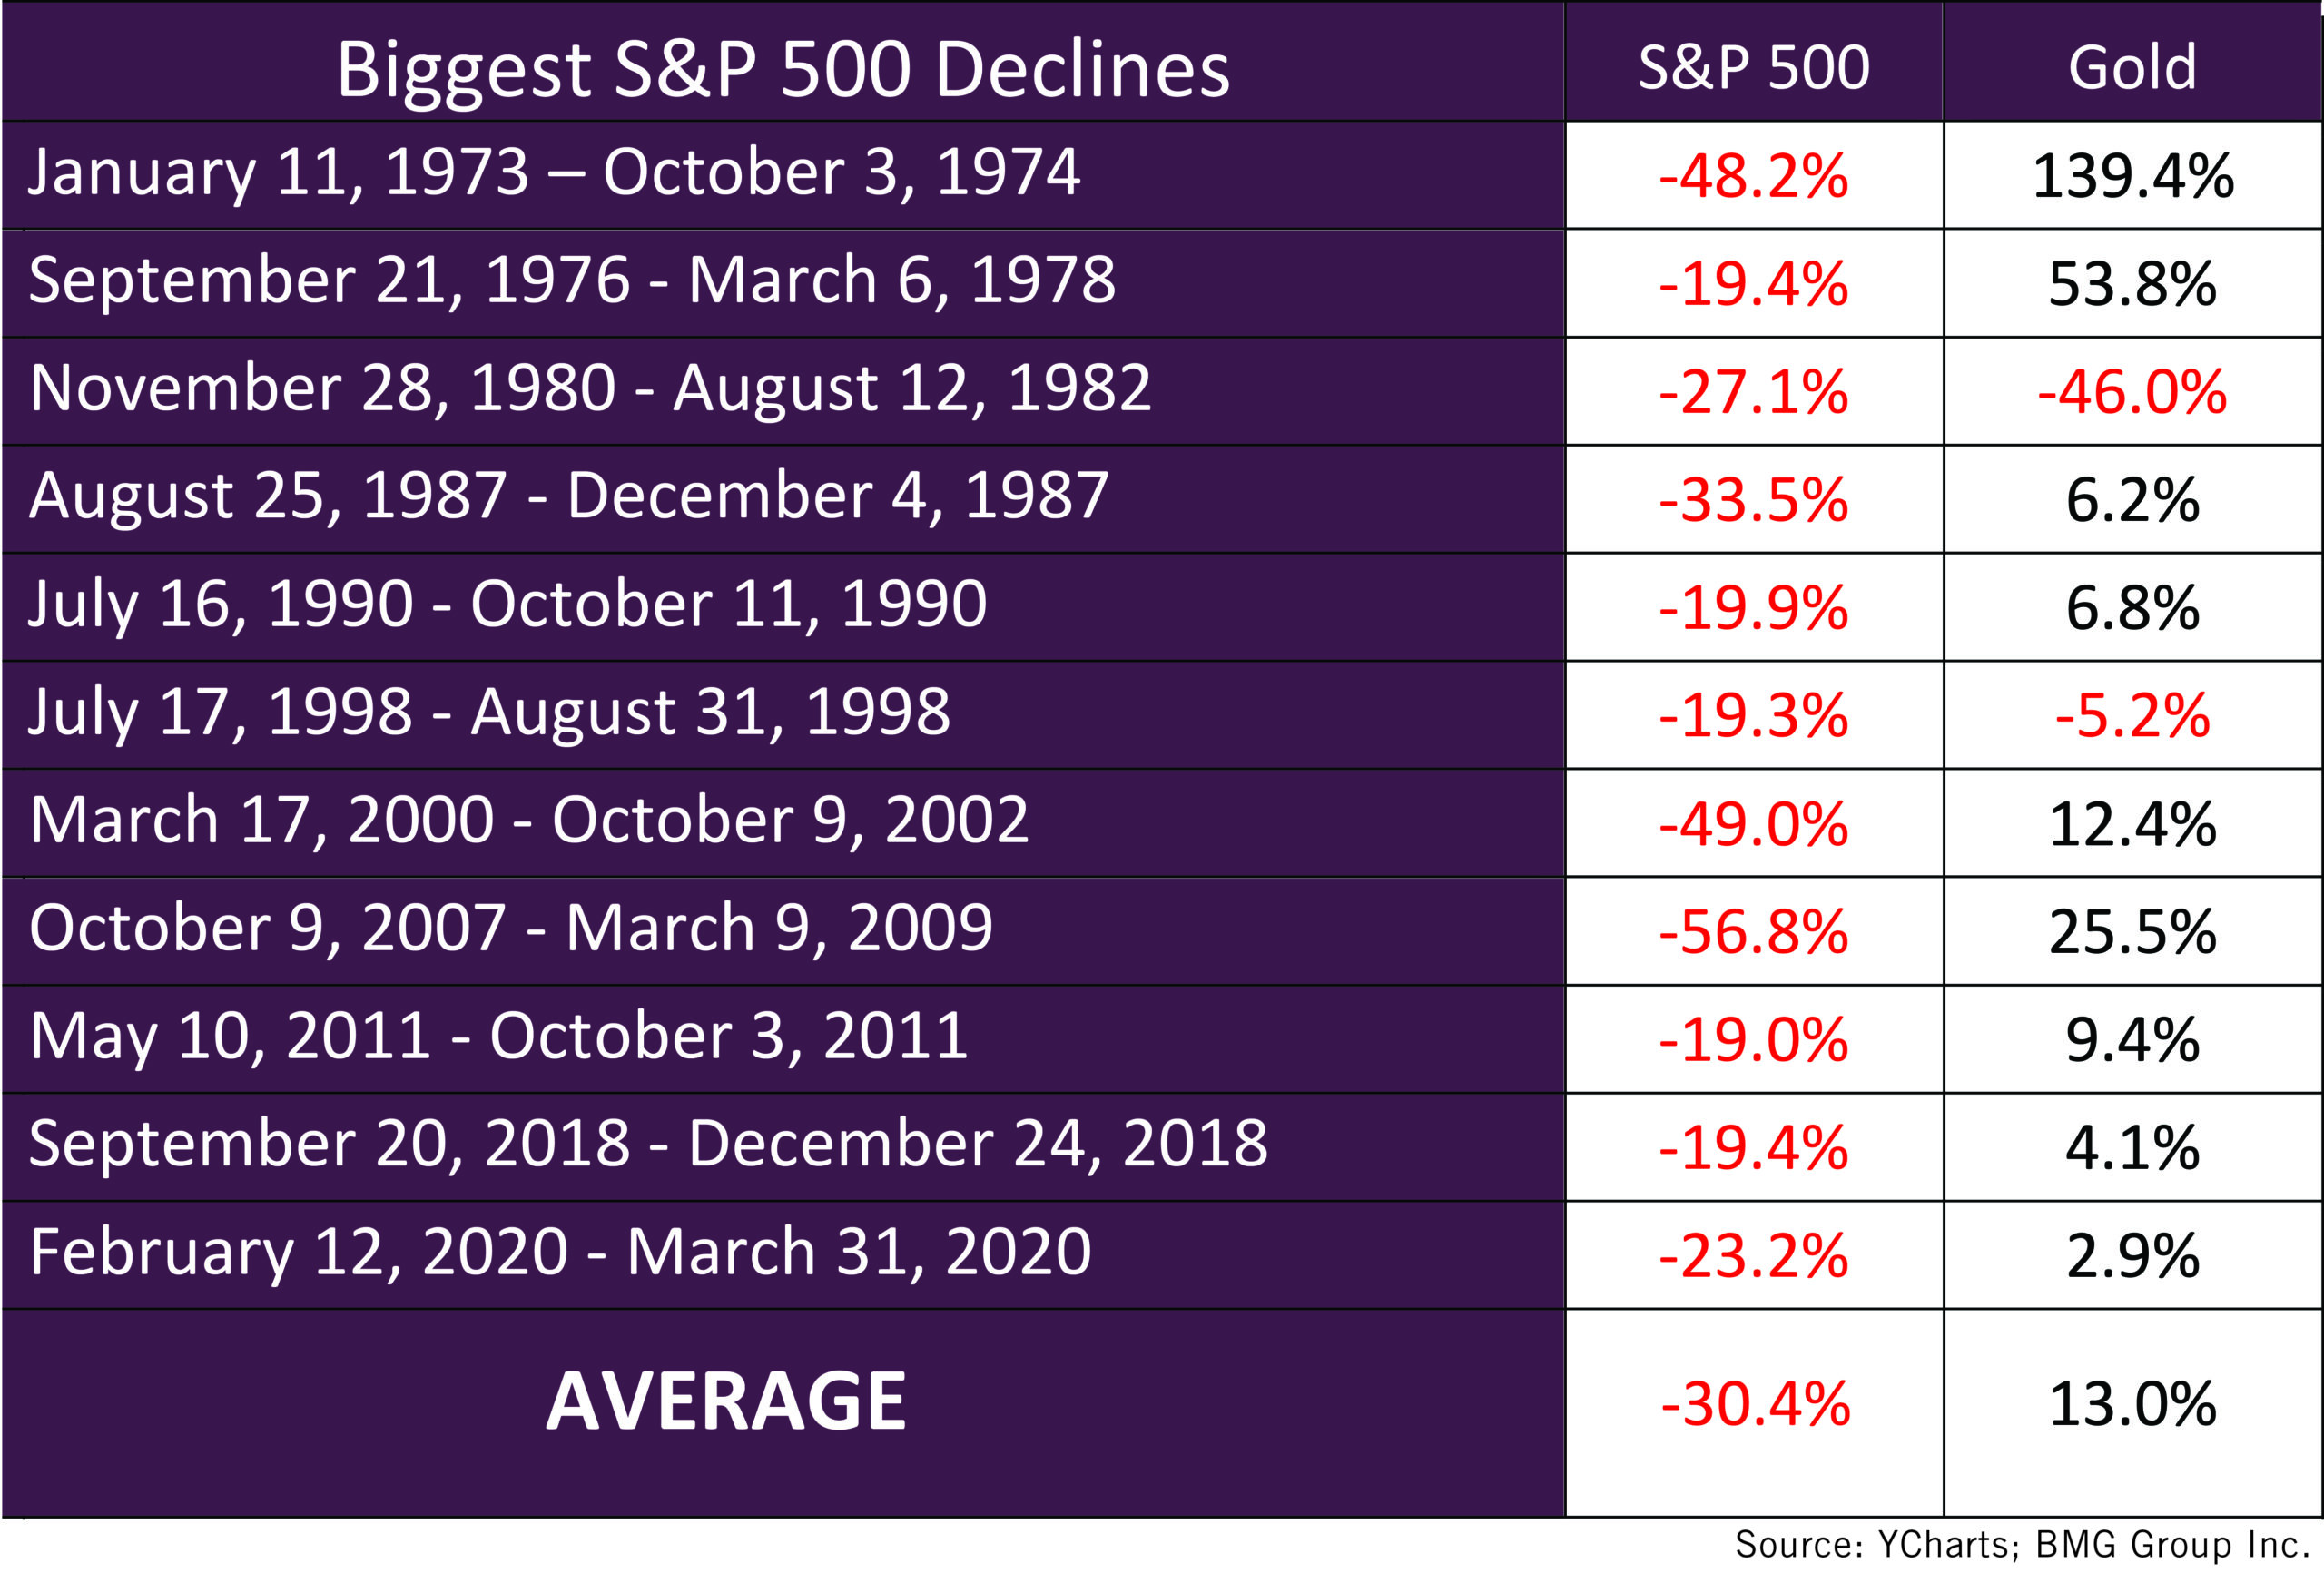
You can see in this performance of physical gold vs stocks during equity market declines chart, that the first case was in 1973, where the S&P lost 48.2% and gold went up 139%. Similarly, in 2007, the S&P declined 56.8%, while gold increased by 25.5%.