Historic Bull and Bear Market | Chart of the Week
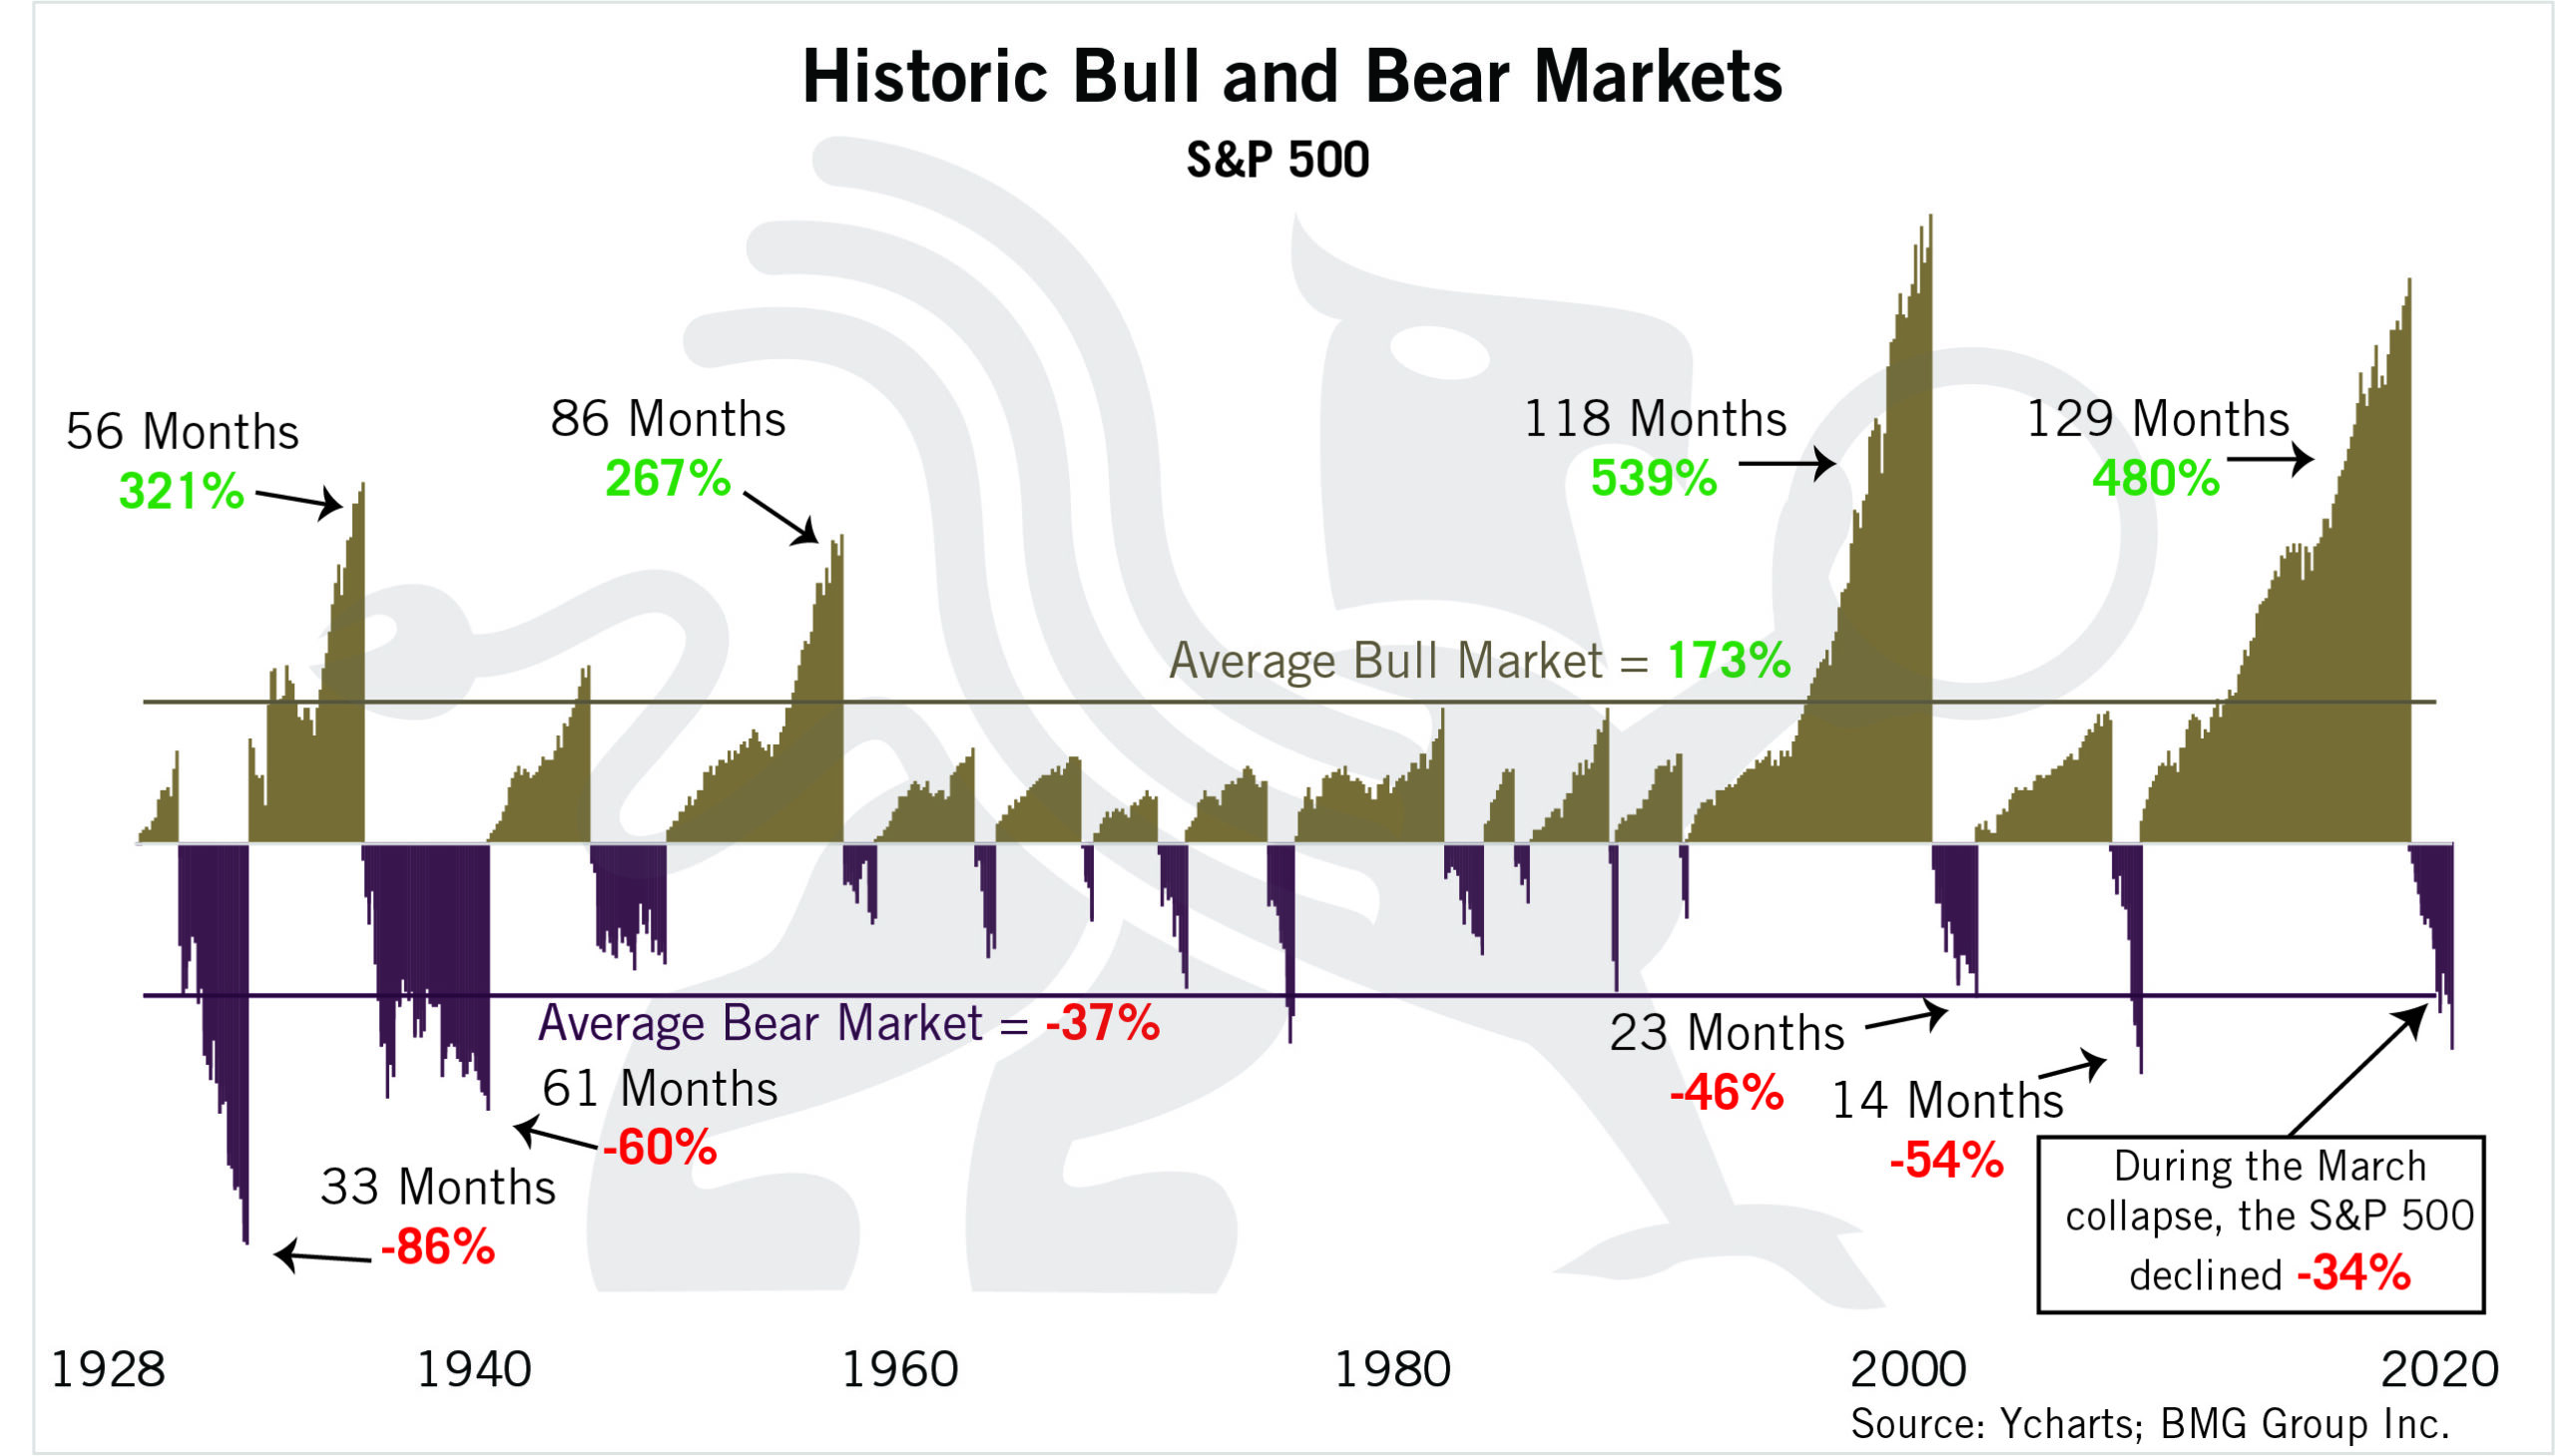
This week’s chart highlights the historic bull and bear markets from 1928 to 2020. As can be seen, during the March collapse in 2020, the S&P 500 declined -34%.
This week’s chart highlights the historic bull and bear markets from 1928 to 2020. As can be seen, during the March collapse in 2020, the S&P 500 declined -34%.