Historical Performance of Precious Metals | BullionBuzz Chart of the Week
This week’s Historical Performance of Precious Metals chart shows the growth of $1 invested in gold, silver and platinum from 1971-2020 in nominal terms.
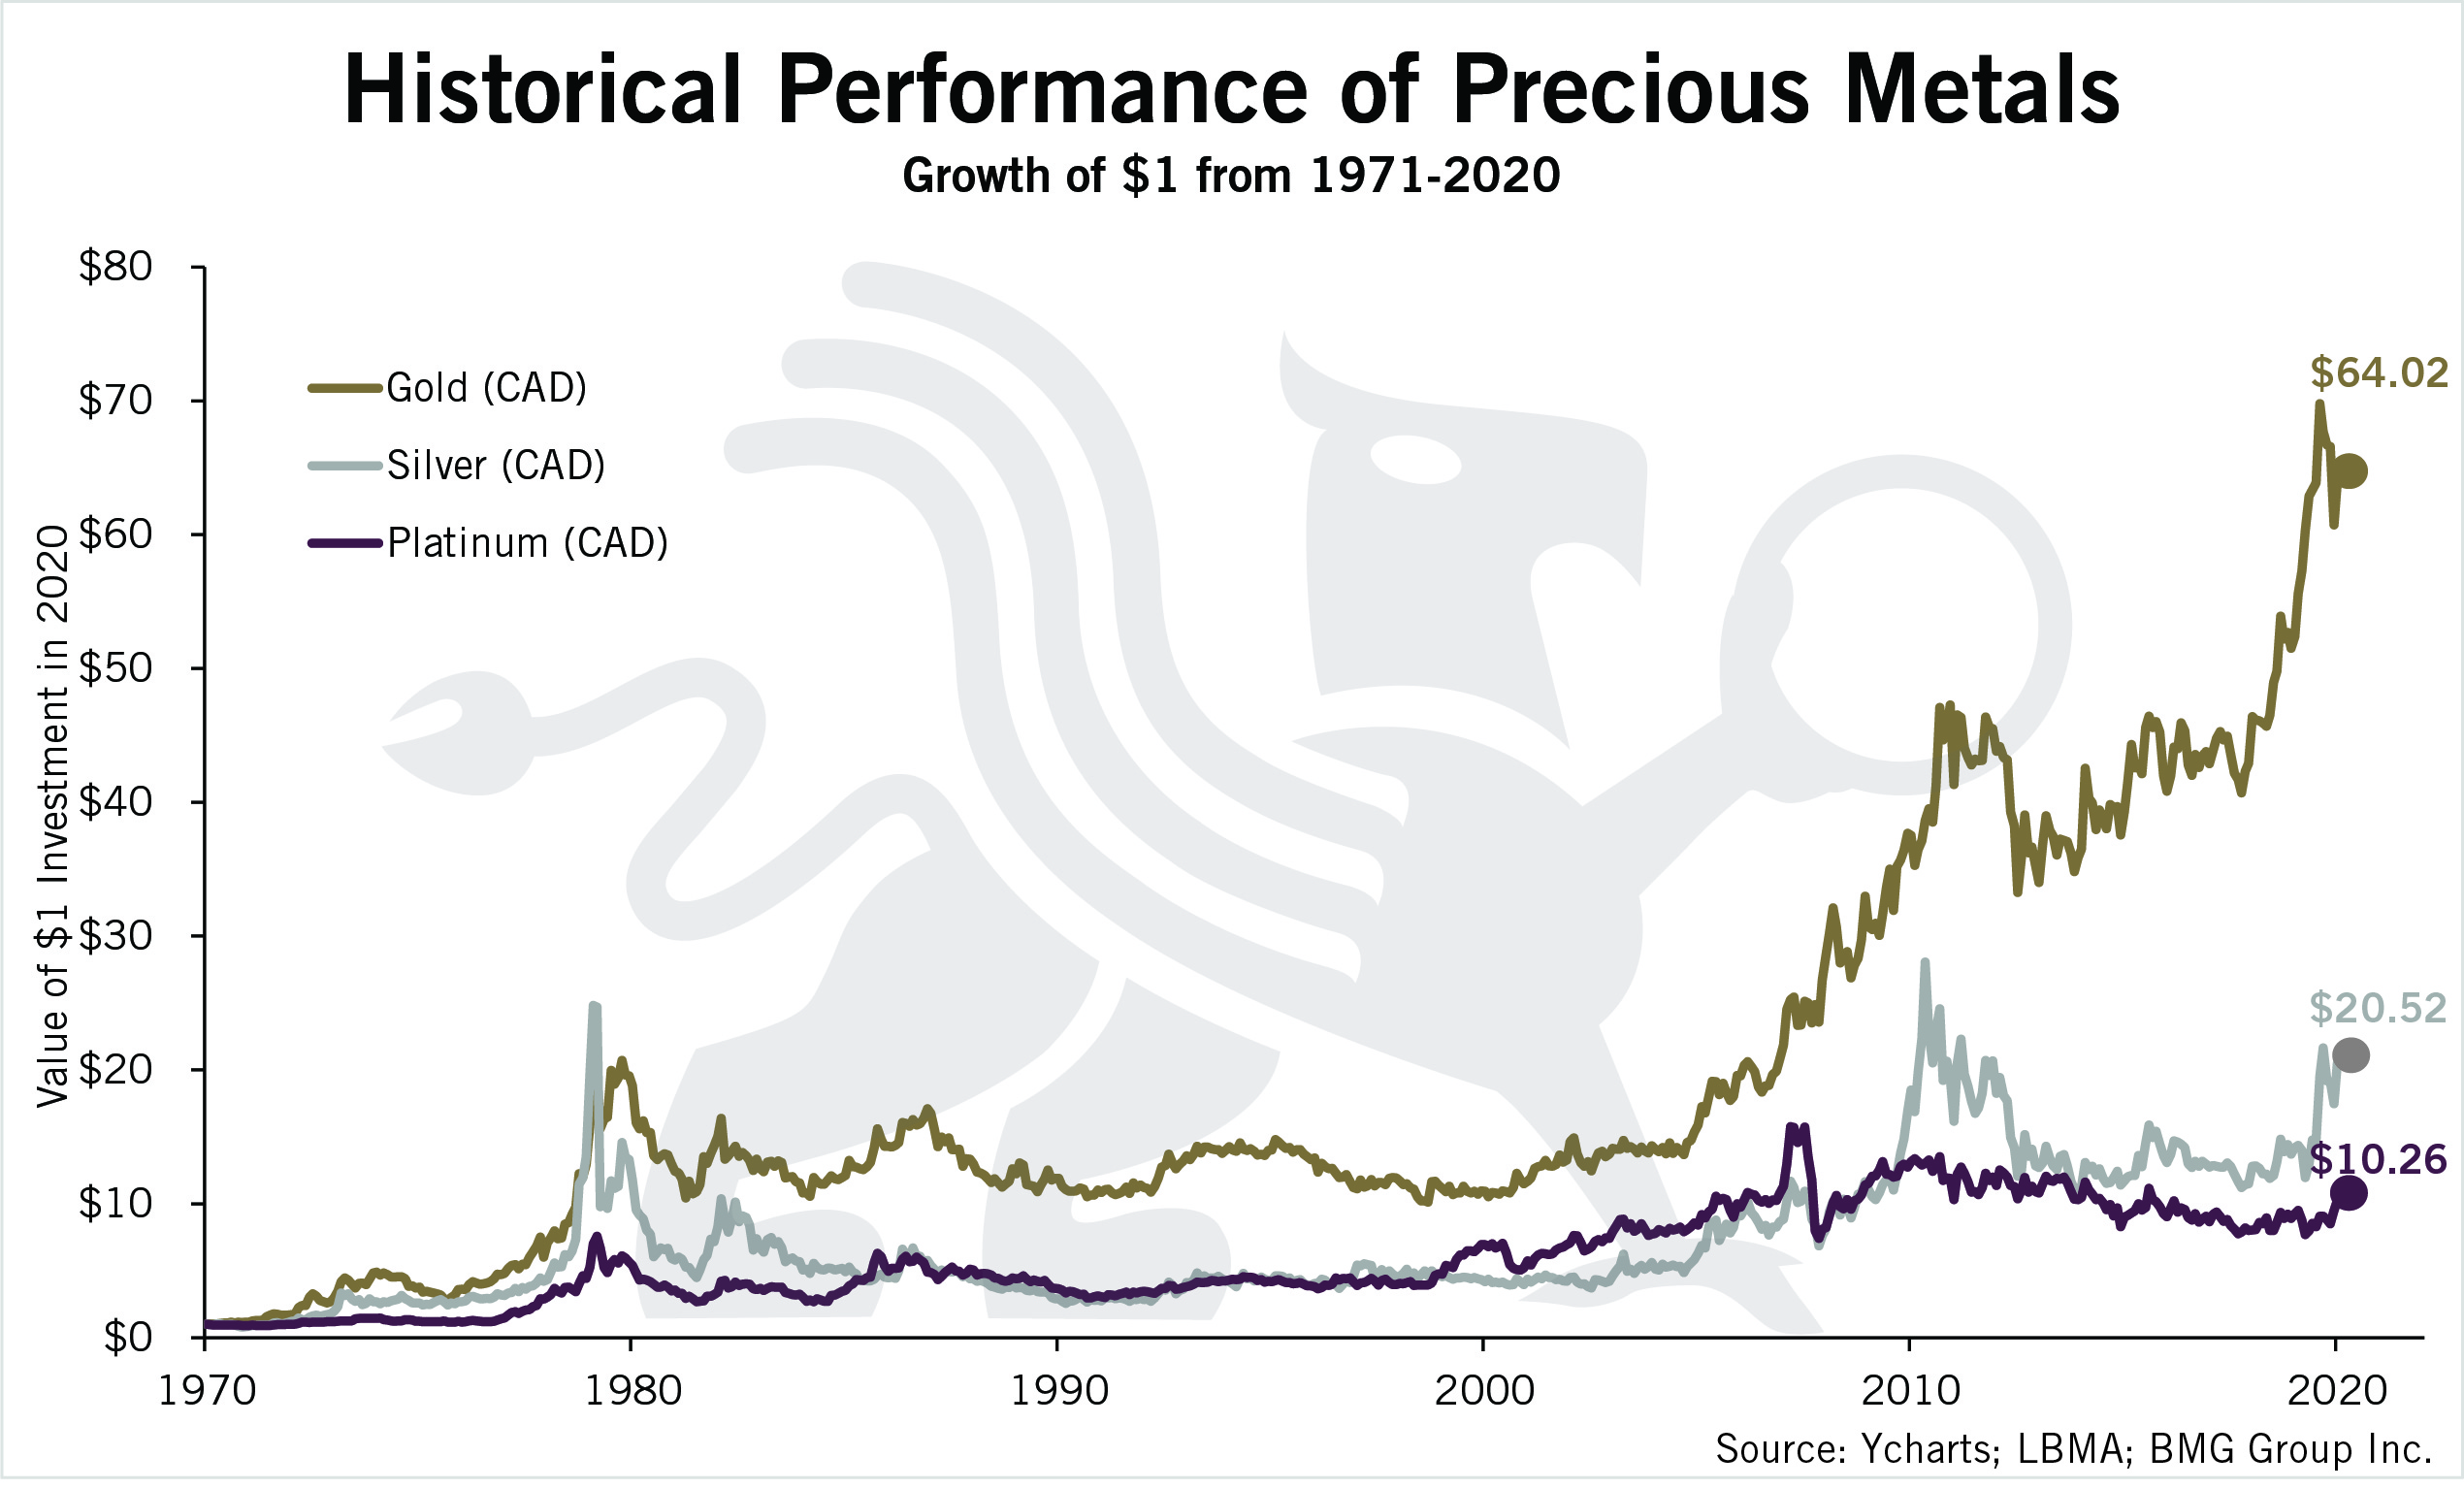
Source: Ycharts; LBMA; BMG Group Inc.