Stagflation Returns | Chart of the Week
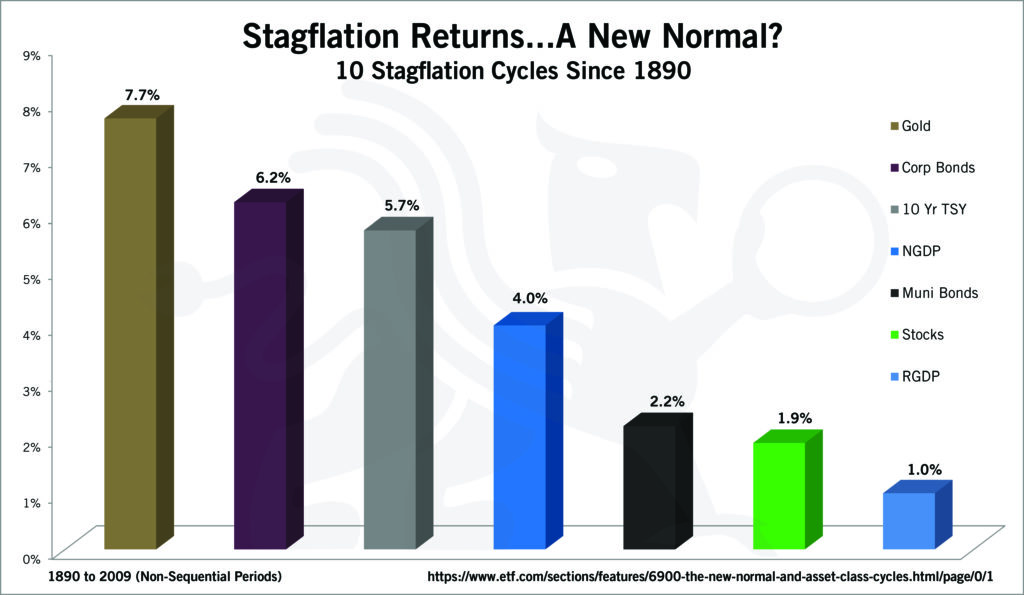
This week’s chart of the week shows 10 stagflation cycles since 1890.
Municipal bonds were the worst performers because stagflation causes state tax revenues to decline. The laden default risks inherent in munis are exposed. Past stagflation periods raised investor concerns about each state’s inability to honor its debts (unlike the federal government, which can print money to avoid default); consequently, munis were repriced for higher default risk.
Source: https://www.etf.com/sections/features/6900-the-new-normal-and-asset-class-cycles.html/page/0/1

