S&P 500 Monthly P/E Ratios | BullionBuzz Chart of the Week
According to Mr. Sozzi, the stock market is one or two bad news away from a collapse. According to his article, valuations on stocks are well overdue for a significant haircut. One way to measure this valuation is by using P/E Ratios. The price-to-earnings ratio indicates the dollar amount an investor can expect to invest in a company in order to receive one dollar of that company’s earnings. The S&P 500 index is widely considered to be the best indicator of how large U.S. stocks are performing on a day-to-day basis. This week’s buzz chart shows monthly P/E Ratios for the S&P 500 from 1871. The chart demonstrates that the P/E Ratio is on the higher end of the spectrum, which means that share price is higher than the earnings per share. With very little room for growth, the market is indeed one or two bad news away from collapse.
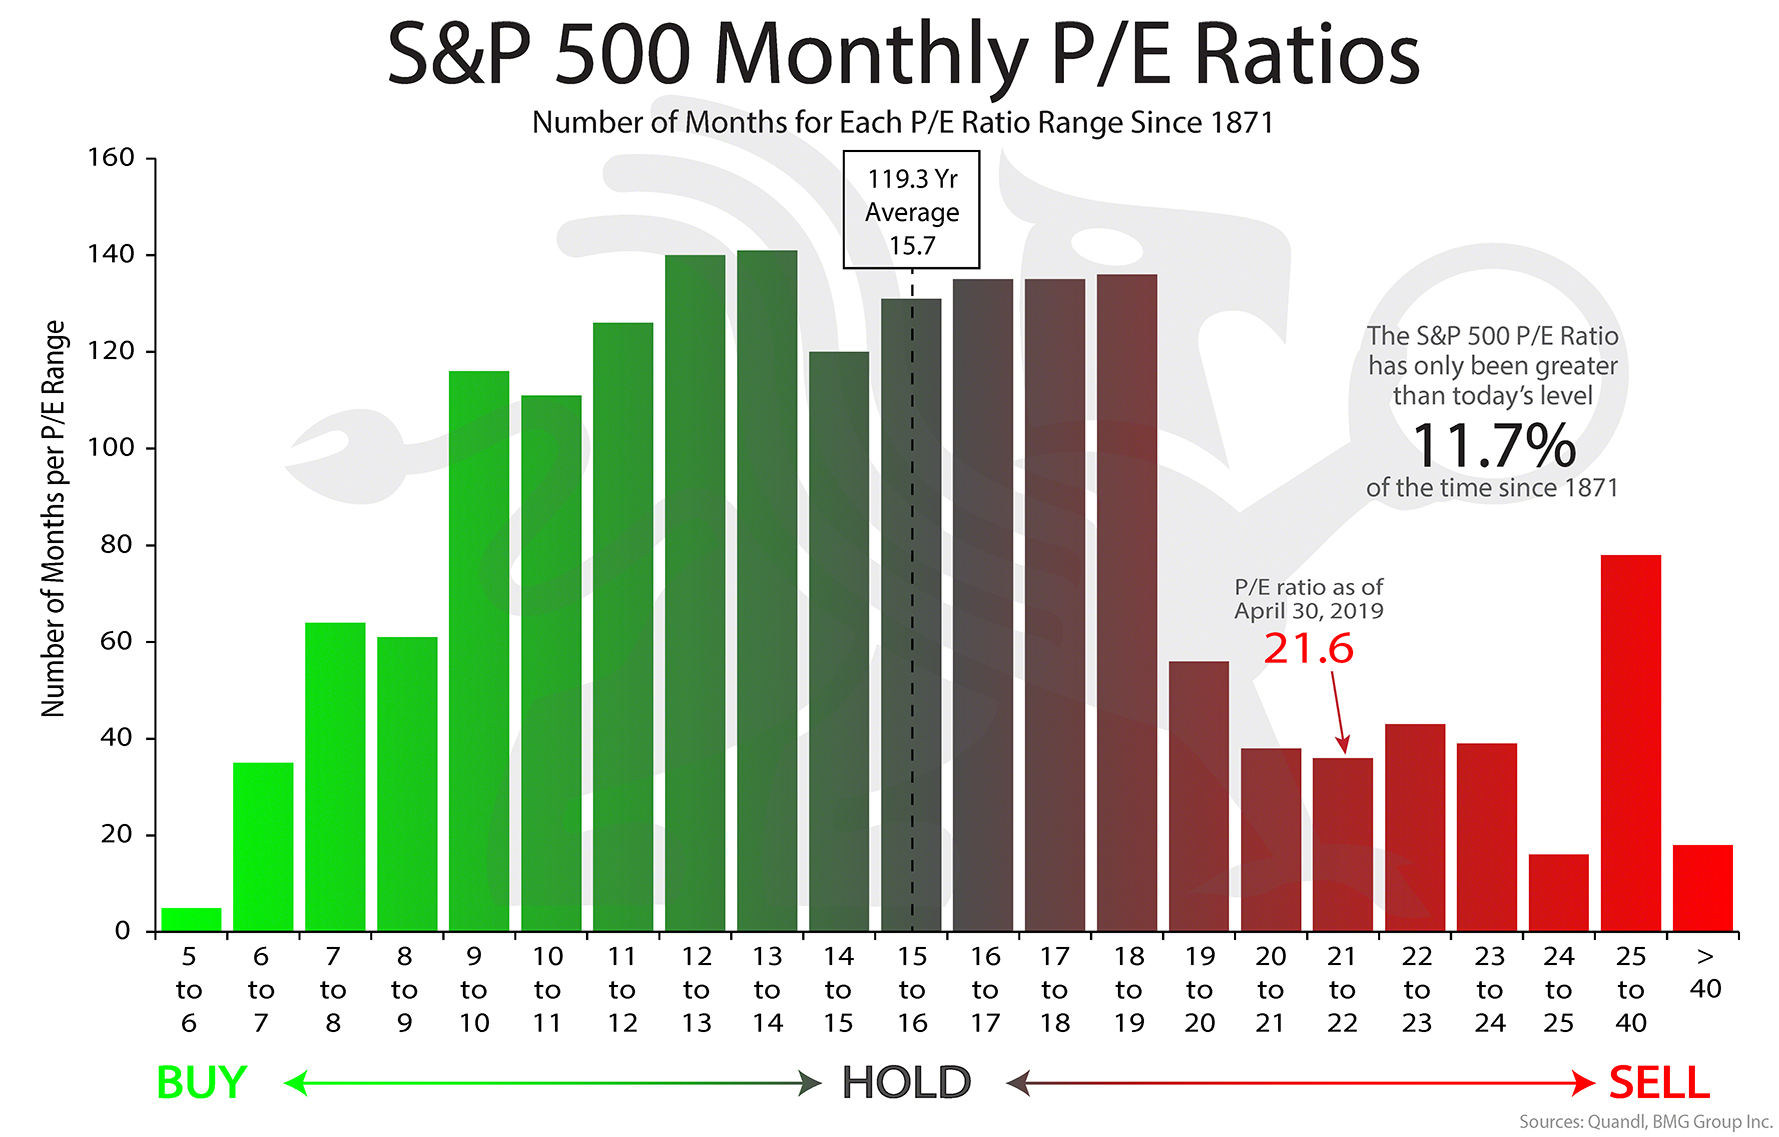
Source: Quandl; BMG Group Inc.
Pingback: 【股票本益比估價法】如何在股海中找到最賺錢的股票? | GD價值投資