Precious Metals Outperform Canadian Indices | Chart of the Week
This week’s Chart of the Week ‘ Precious Metals Outperform Canadian Indices, uses the TSX and Venture Index, which encompasses a 19-year performance from December 2001 to December 2020. This time period was chosen because we were unable to identify data on TSX-V prior to 2001. Price return was also used for this chart rather than total return.
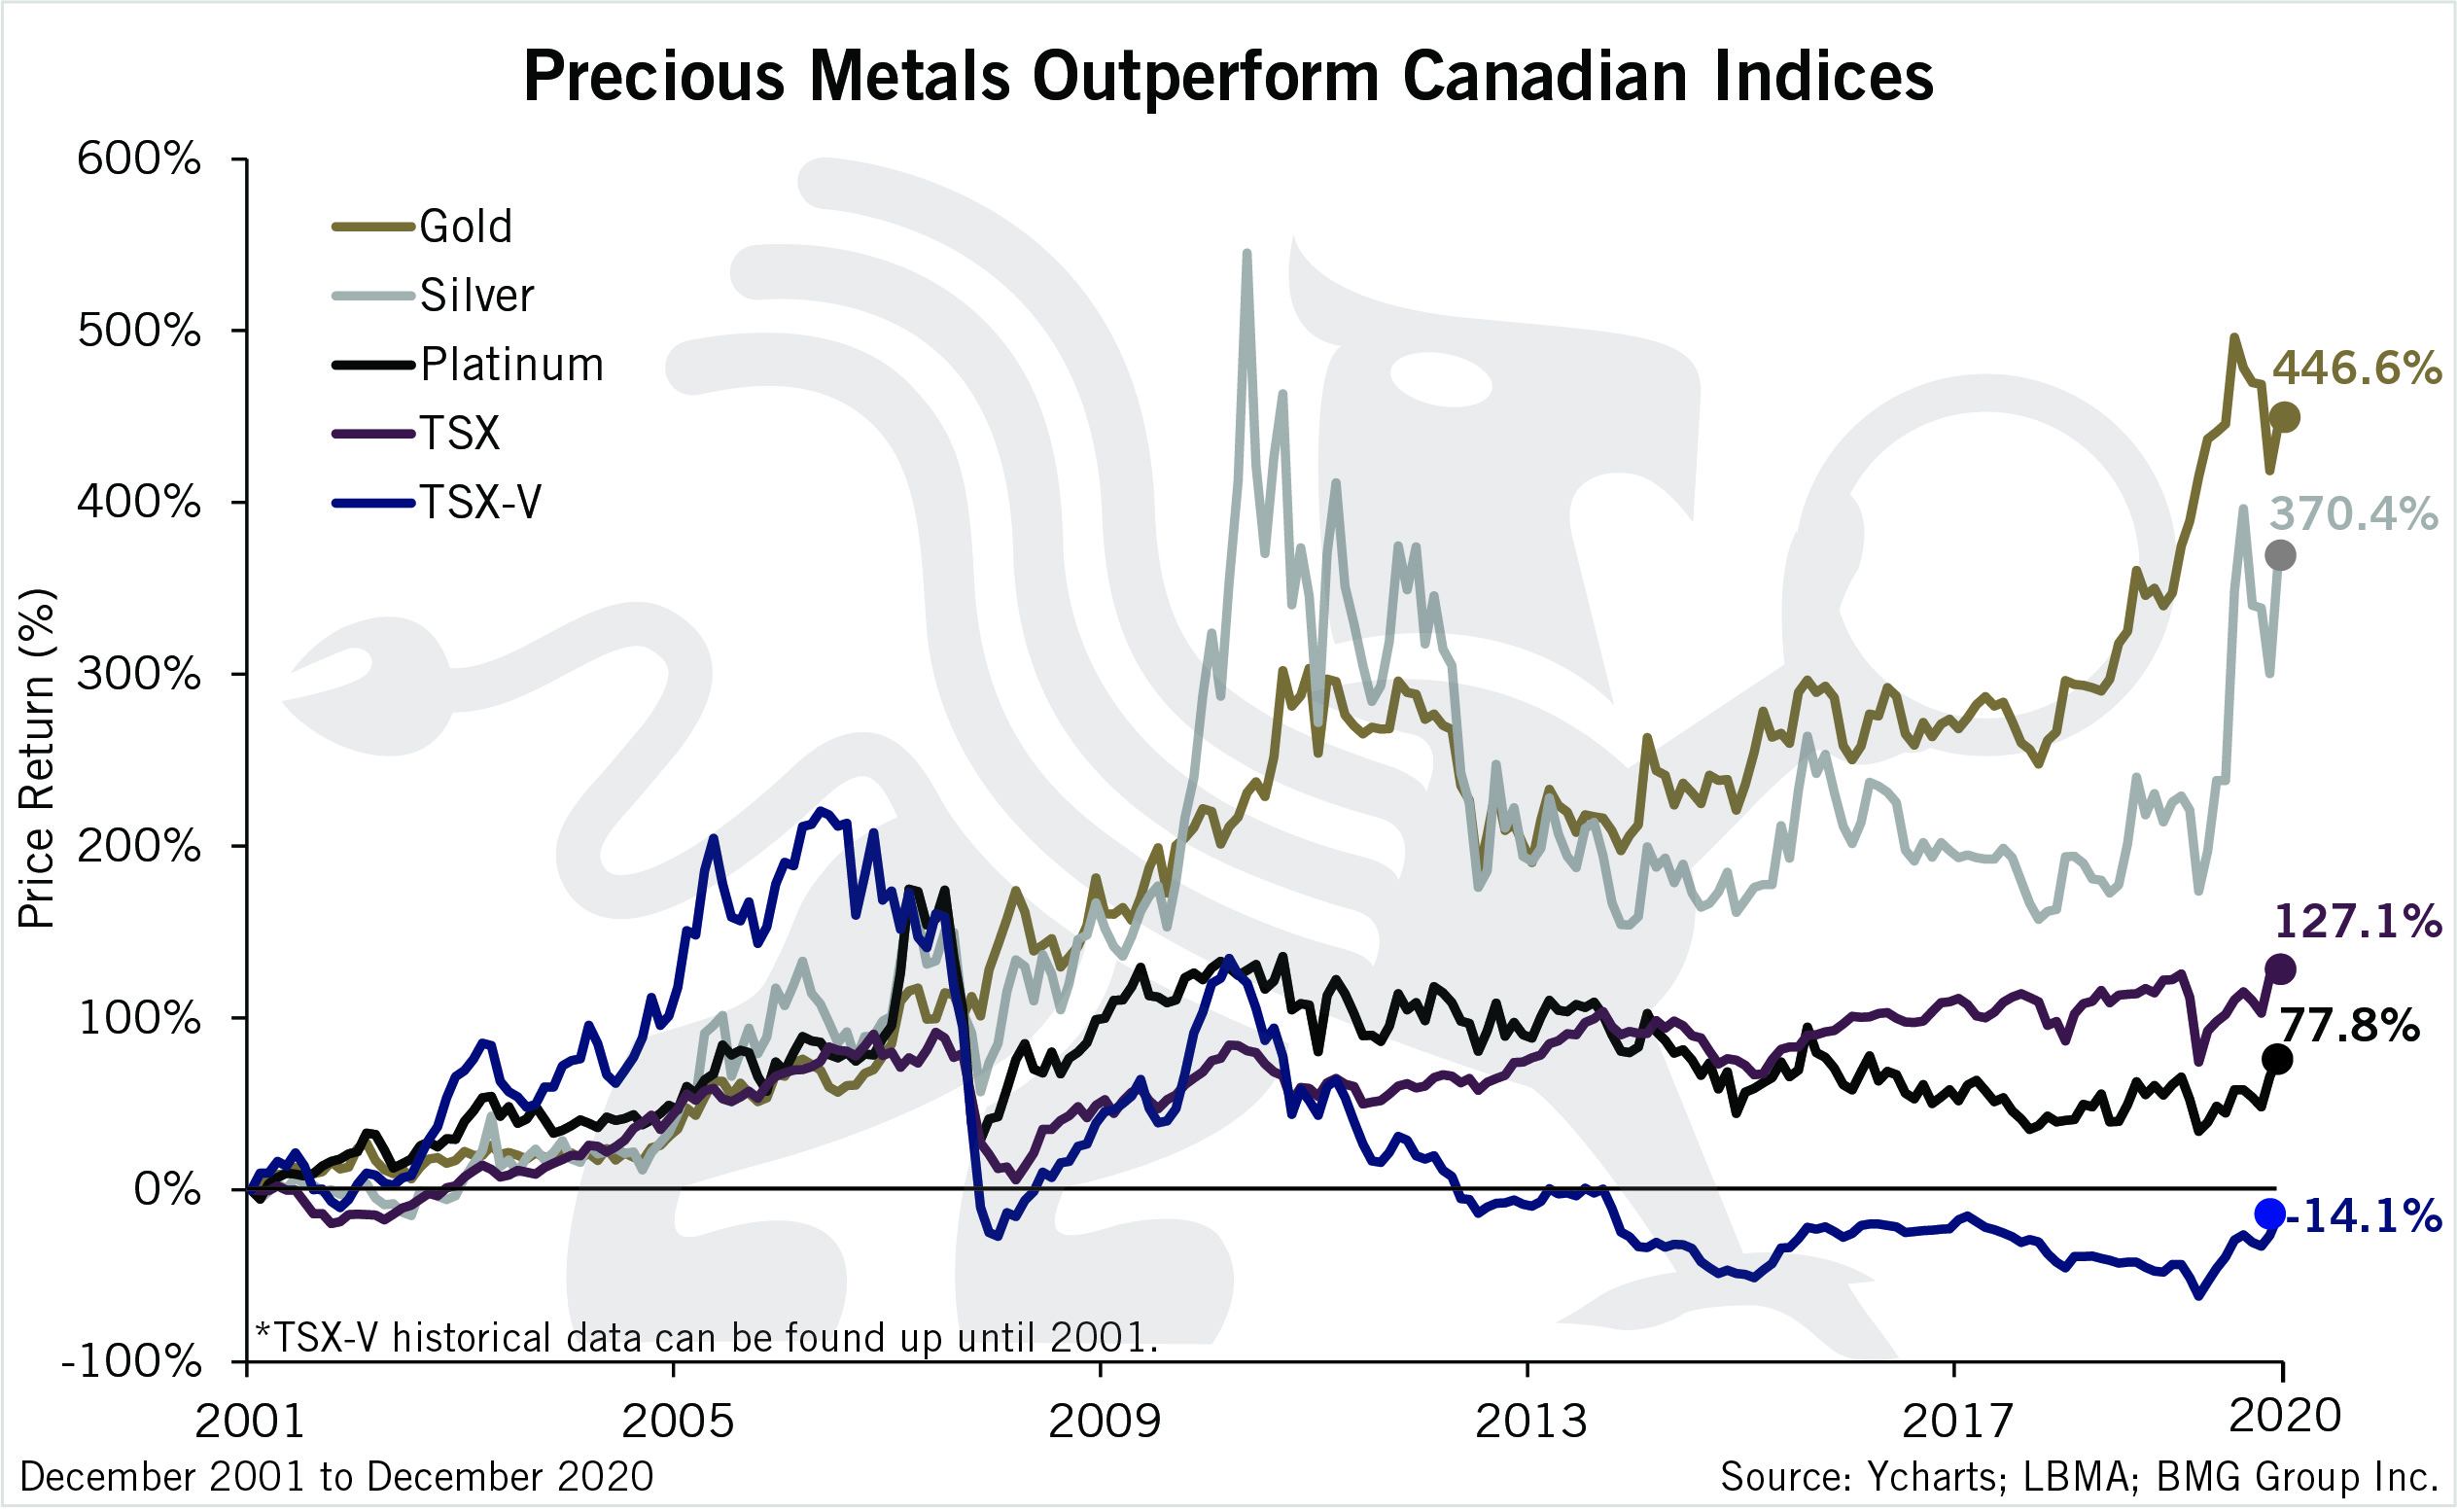
Source: Ycharts; LBMA; BMG Group Inc.
