Dow Gold Ratio Chart Updated
Dow Gold Ratio Chart Updated | BullionBuzz Chart of the Week How many ounces of gold does it take to buy one unit of the Dow Jones? Sources: FactSet; LBMA;…
Dow Gold Ratio Chart Updated | BullionBuzz Chart of the Week How many ounces of gold does it take to buy one unit of the Dow Jones? Sources: FactSet; LBMA;…
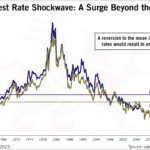
Interest Rate Shockwave: A Surge Beyond the Norm | Chart of the Week The week's BullionBuzz Chart of the Week, is entitled "Interest Rate Shockwave: A Surge Beyond the Norm.Mean…
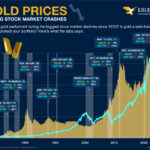
Gold Prices During Stock Market Crashes | Chart of the Week Gold has traditionally been considered the ultimate "safe-haven asset," offering protection to investors in times of stock market turmoil.…
From Five to Many: Exploring BRICs Influence Through Expansion | Chart of the Week BRICS constitutes a consortium of five prominent nations—Brazil, Russia, India, China, and South Africa. Defined by…
Three Decades of Central Bank Gold Demand | Transition from Net Sales to Net Acquisitions | Chart of the Week Sources: Visualcapitalist, Metals Focus, Refinitiv GFMS, World Gold Council, BMG…
Loss of Purchasing Power by Decade (USD) | Chart of the Week Sources: Ycharts; Statistics Canada; BMG Group Inc. Purchasing power refers to how much you can buy with your…
Silver Demand Surges Ahead | Chart of the Week An Upward Trend as Supply Struggles to Keep Pace Sources: Ycharts; LBMA; Metals Focus; BMG Group Inc. Investors are starting to…
US Dollar Index's Relationship with Gold | Chart of the Week Sources: Ycharts; LBMA; finance.yahoo; BMG Group Inc. The U.S. Dollar Index (USDX), also known as the DXY index, is…
National Debt and Debt Ceiling Increases | Chart of the Week According to Ray Dalio, when debt assets and liabilities grow at a faster rate than income, it eventually becomes…
Silver Price History - Price of Silver Over Time (Inflation-Adjusted) | Chart of the Week Lots of things can impact the silver price—the economy, US dollar, inflation expectations, among others—but…