Outlook For Gold in 2020 | Empire Club of Canada | Investment Outlook 2020
Good afternoon. It is a pleasure to speak at the Empire Club today.
The first time I spoke at the Empire Club was in 2005. I said then that it would not matter to bullion investors if gold ended the year at $400/ounce or $500/ounce, based on the long-term price outcome. Gold ended the year at USD $513.
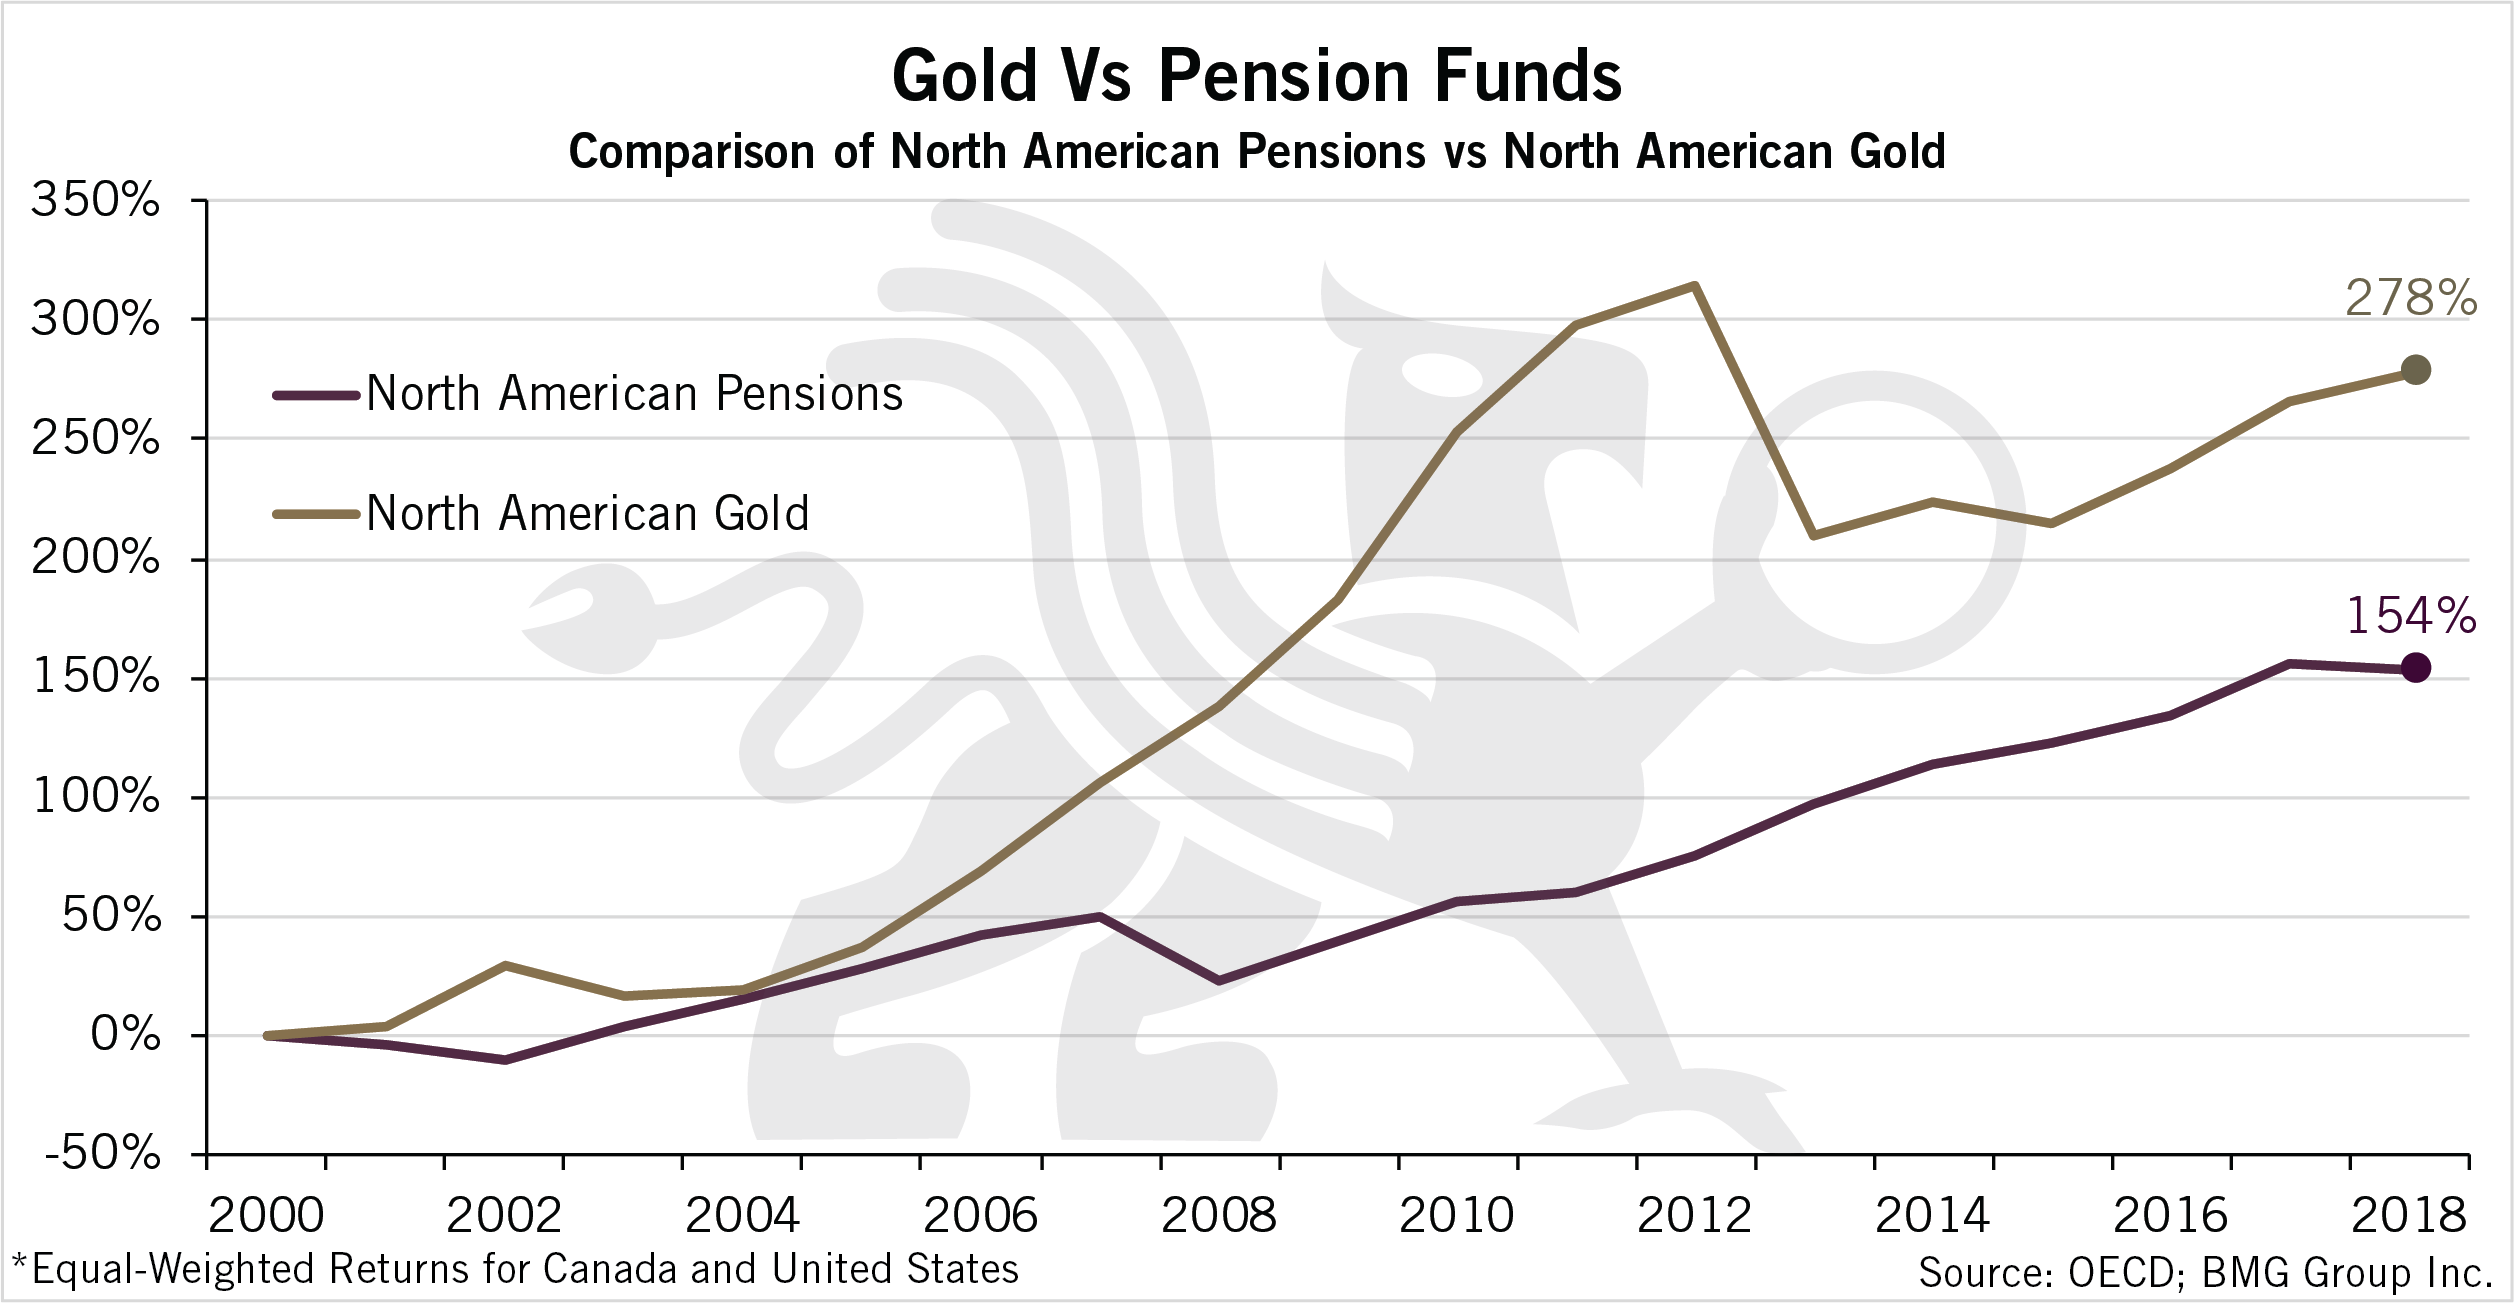
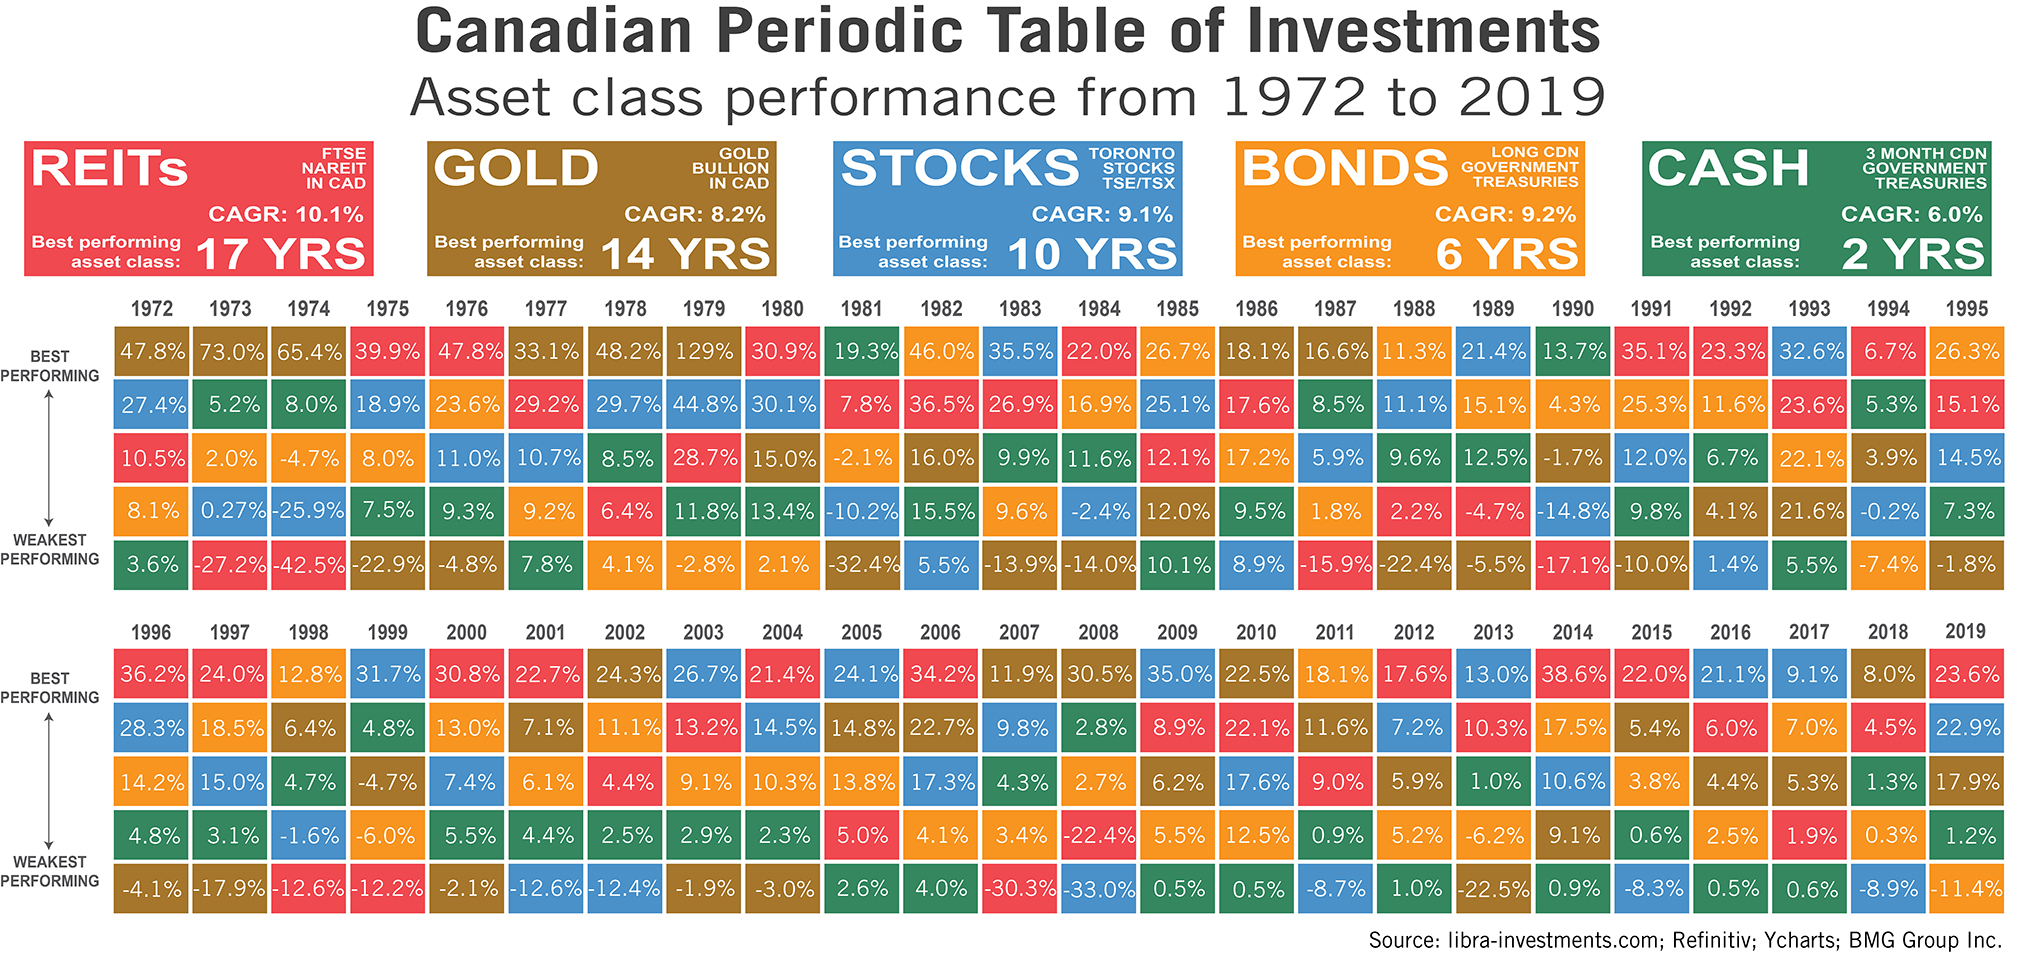
Gold had a good year in 2019, rising about 18%. Since 2000, gold has averaged 11% annually in the major currencies, with 9.7% in USD and 8.8% in Canadian.
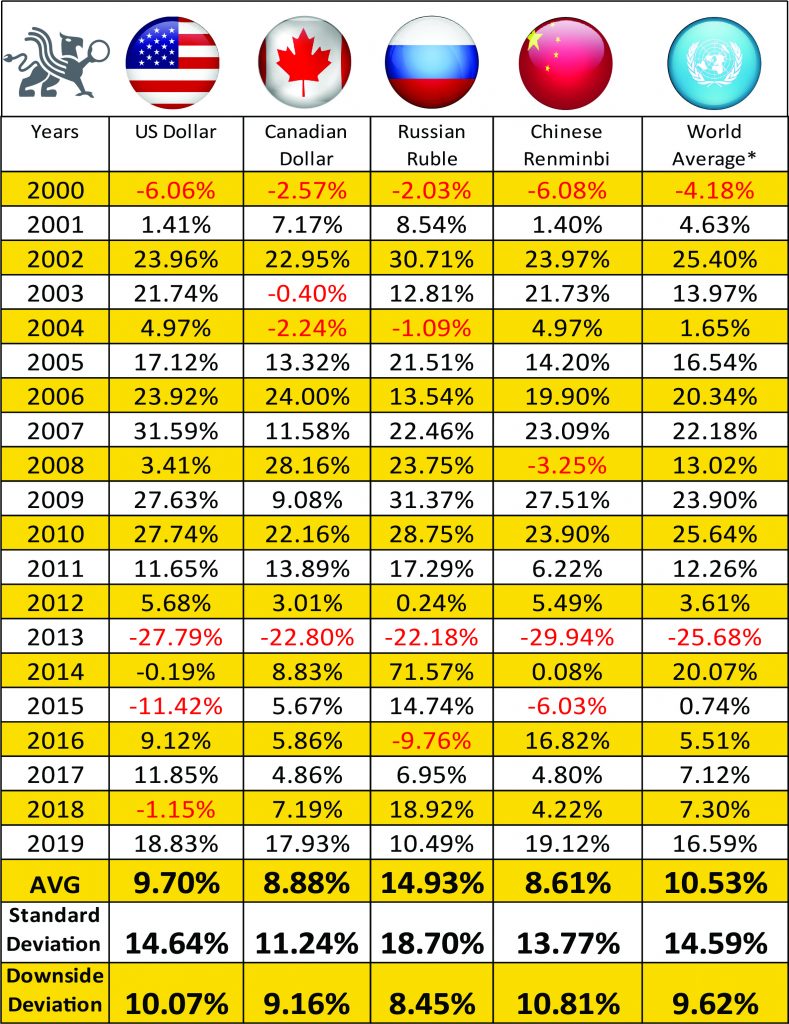
According to the OECD, the average annual 15-year pension returns were 6.6% in Canada and 2.6% in the US. You don’t need a complicated algorithm or a computer to conclude that an allocation to gold would have improved returns and reduced volatility. However, other than three global pension funds, none have any gold and most have no allocation to REITs.
Yes, today, investors are euphoric and financial markets have set historic highs regularly, but they are highly overvalued by every conventional measure. This year, I promise my annual offering of doom and gloom, but I would also like to offer a contrarian strategy for protecting against losses, and even profiting during the inevitable market correction.
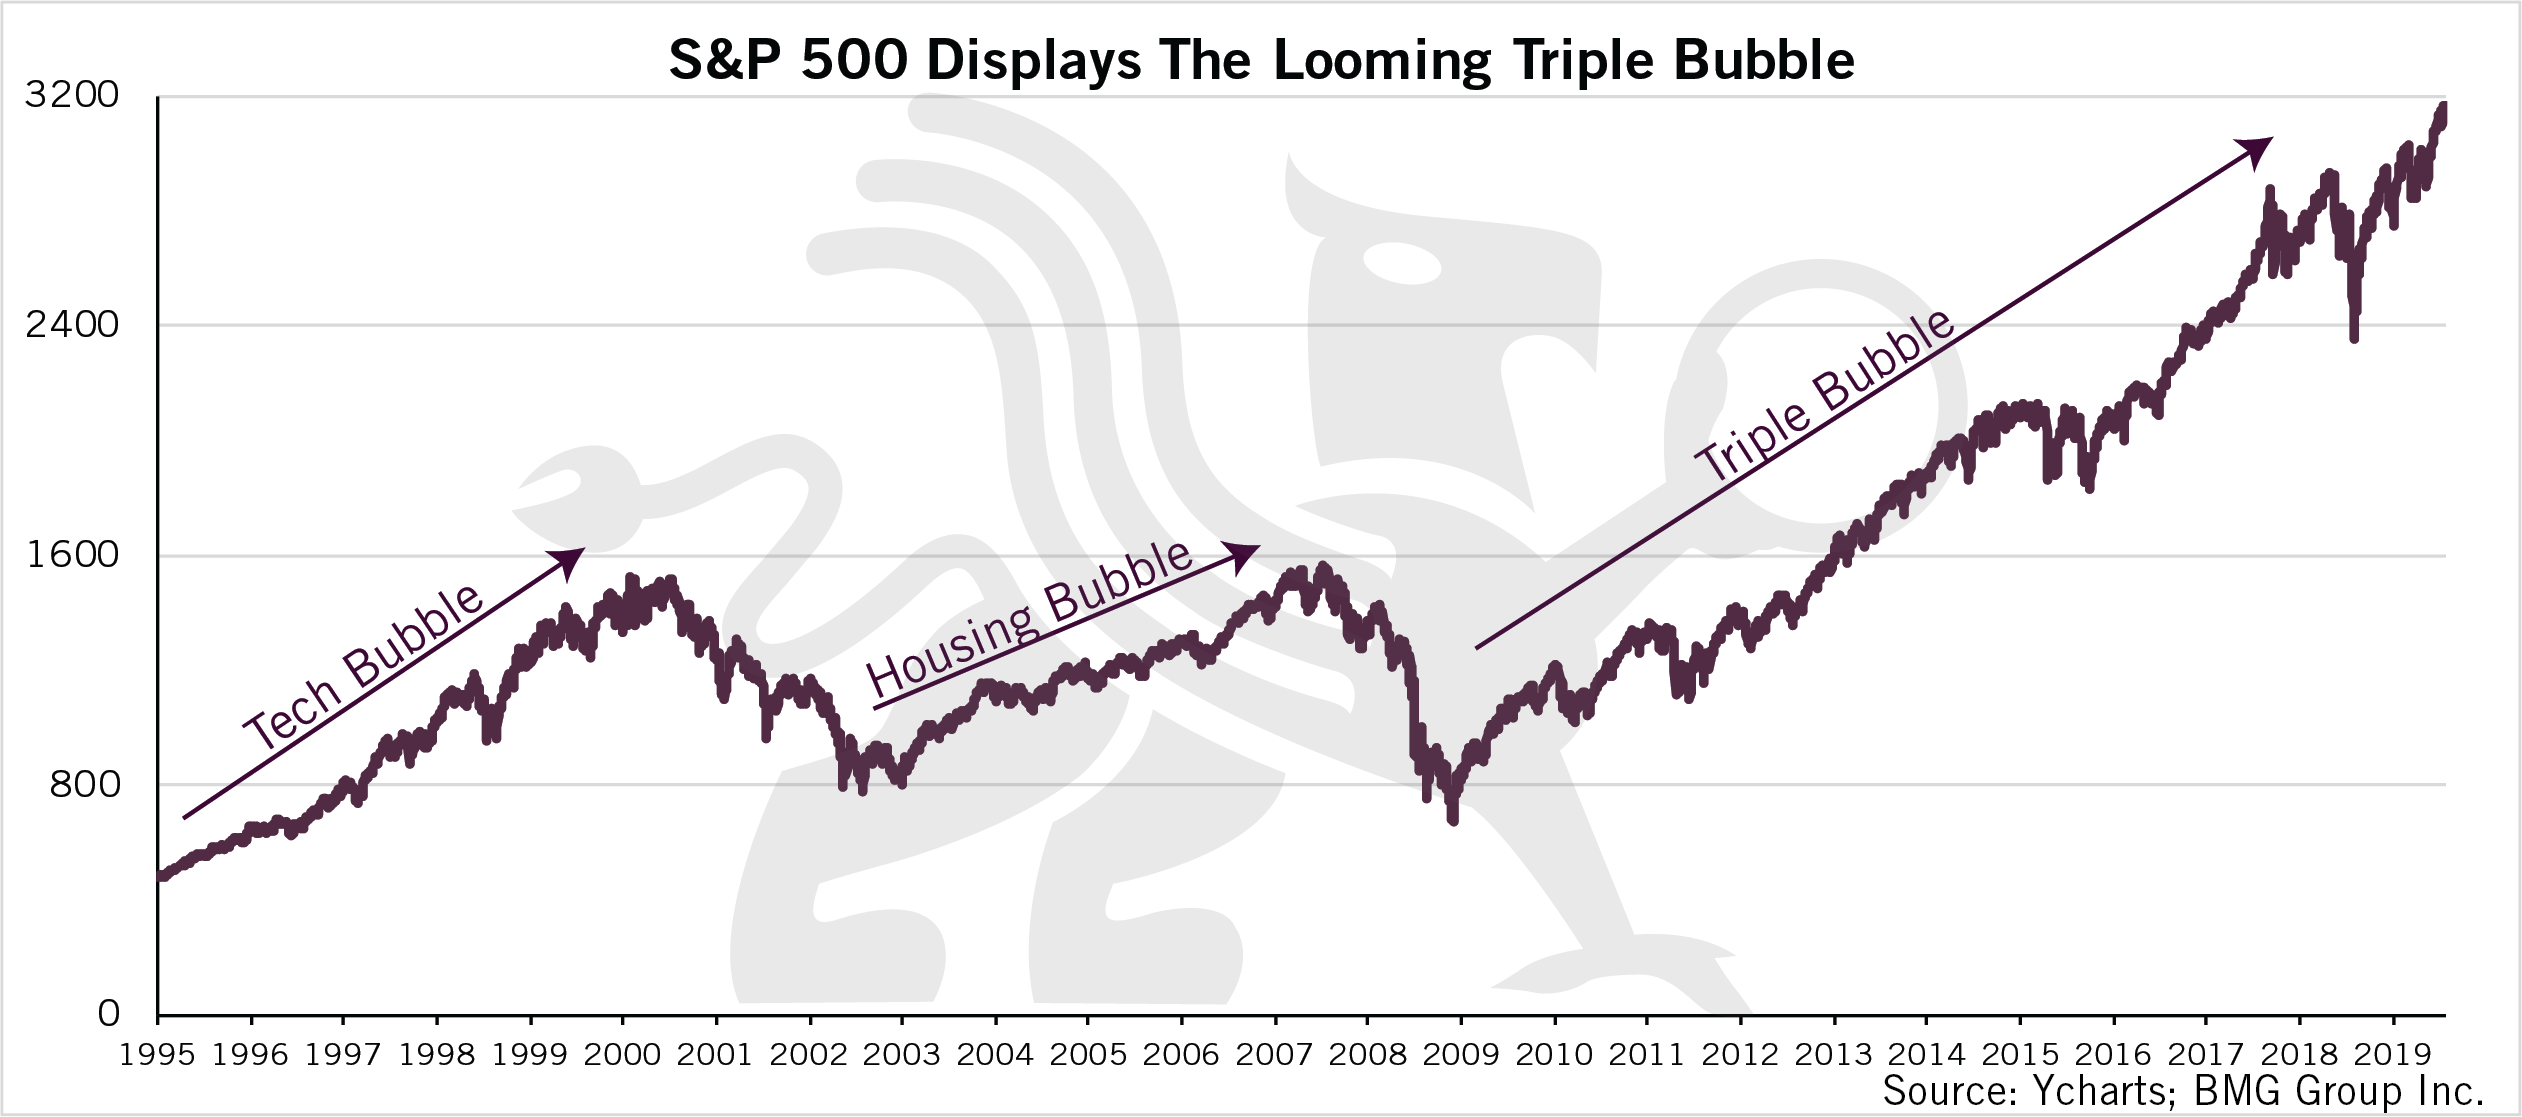
This is the first time during the 40 years I have been in business that a simultaneous triple bubble in equities, bonds and real estate has occurred. There is a direct correlation to the amount of liquidity central banks are injecting into the system on a daily basis and these inflated asset prices.
To quote David Stockman on this topic:
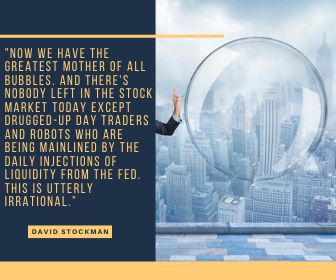
“Now we have the greatest mother of all bubbles. And there’s nobody left in the stock market today except drugged-up day traders and robots who are being mainlined by the daily injections of liquidity from the Fed. This is utterly irrational.”
Many economists and financial analysts believe the next correction will be worse than 2008, and some think it will be worse than 1929. In 2008, the total US debt was $8 trillion; today it is $23 trillion.
In 1929, it was only $17 billion.
The 2008 crisis was precipitated by the Lehman collapse, but today a Deutsche Bank collapse would be 10 times the size. At $48 trillion, it has one of the largest derivatives books in the world. In addition, margin debt in the US has increased by 223% since 2008. This will make the next correction much worse.
According to Case Shiller, US real estate price levels are once again at highs achieved in 2007; there is over $12 trillion of negative-yielding sovereign debt; and US equities have been in the longest bull market in history and have increased 480% since the 2008 crisis. In both real estate and equities, individual and corporate earnings have been in decline since 2012, but prices of equities and real estate have risen.

As you can see, a simple reversion to the bear market average for the S&P 500 would indicate a 46% decline. However, most recent bear market declines overshoot the bear market average.
Whereas the 2008 crisis
was largely due to changing perceptions of the quality of $1.2 trillion of
sub-prime mortgage debt, today, student loan debt is $1.6 trillion and global pension funds are estimated to have
about $78 trillion in unfunded liabilities. In addition, the largest 25
companies in the S&P 500 have unfunded pension liabilities of $151 billion.
In the US, public
pensions and Medicare are underfunded by $120 trillion, or the equivalent or $367,000/person.
In Canada, public sector unfunded liabilities are $2.2 trillion, or $243,000/person. Companies listed on the TSX 100 have $100 million in unfunded liabilities. Since most of these liabilities were incurred during the longest bull market in history, it is likely that, during the next correction, the losses in pension assets will increase unfunded liabilities by the same amount as the declines in assets.
In California, a number of municipalities have already sent out notices to retired teachers, firemen and policemen stating that their future pension payments will be reduced by 50%. The US Pension Benefit Guarantee Corporation is projected to collapse by 2025. The dissipation of the PBGC would leave retirees with about 2% of what they had counted on for retirement. In France and Chile, riots have broken out due to proposed reforms. Since most pension funds are only holding stocks and bonds, there will be class action lawsuits when pensioners do not receive their promised pensions. There will be absolutely NO justification as to why CEOs, plan administrators and portfolio managers have failed in their fiduciary duties to properly diversify their pension portfolios. More importantly, there is no excuse for omitting the best-performing asset classes – REITs and precious metals.
In the near future, it will only take a small percentage of the $350 trillion in financial assets reallocating to gold to cause an exponential rise in price. Mine production and new discoveries are in decline, and central banks are setting records in gold purchases. There is only about $1.9 trillion of aboveground investment-grade gold bullion available. Since most of it is already held by the world’s wealthiest families, it is unlikely that it will come onto the market at any price. The bottom line is that, unlike paper securities, which can be created without limit, gold supply is known, limited, and can only increase with actual mining production. When it becomes obvious to market participants that the next correction is upon us, it will become difficult for pension funds to achieve a meaningful percentage allocation without driving the price to multiples of today’s price.
According to Ray Dalio:
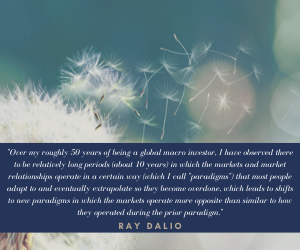
“Over his roughly 50 years of being a global macro investor, he has observed there to be relatively long periods (about 10 years) in which the markets and market relationships operate in a certain way (which he calls “paradigms”) that most people adapt to and eventually extrapolate so they become overdone, which leads to shifts to new paradigms in which the markets operate more opposite than similar to how they operated during the prior paradigm.”
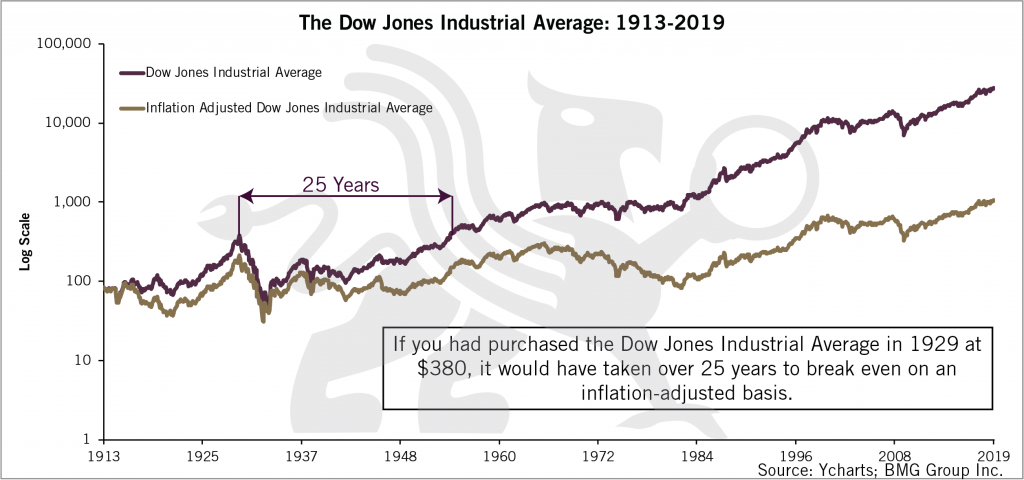
While conventional advice is to always stay invested, this is not the best strategy when we are at the end of the current paradigm. If you held your position after the 1999 high-tech crash, you didn’t break even on an inflation-adjusted basis until recently. If you had held your position in 1929, it would have taken 25 years to break even.
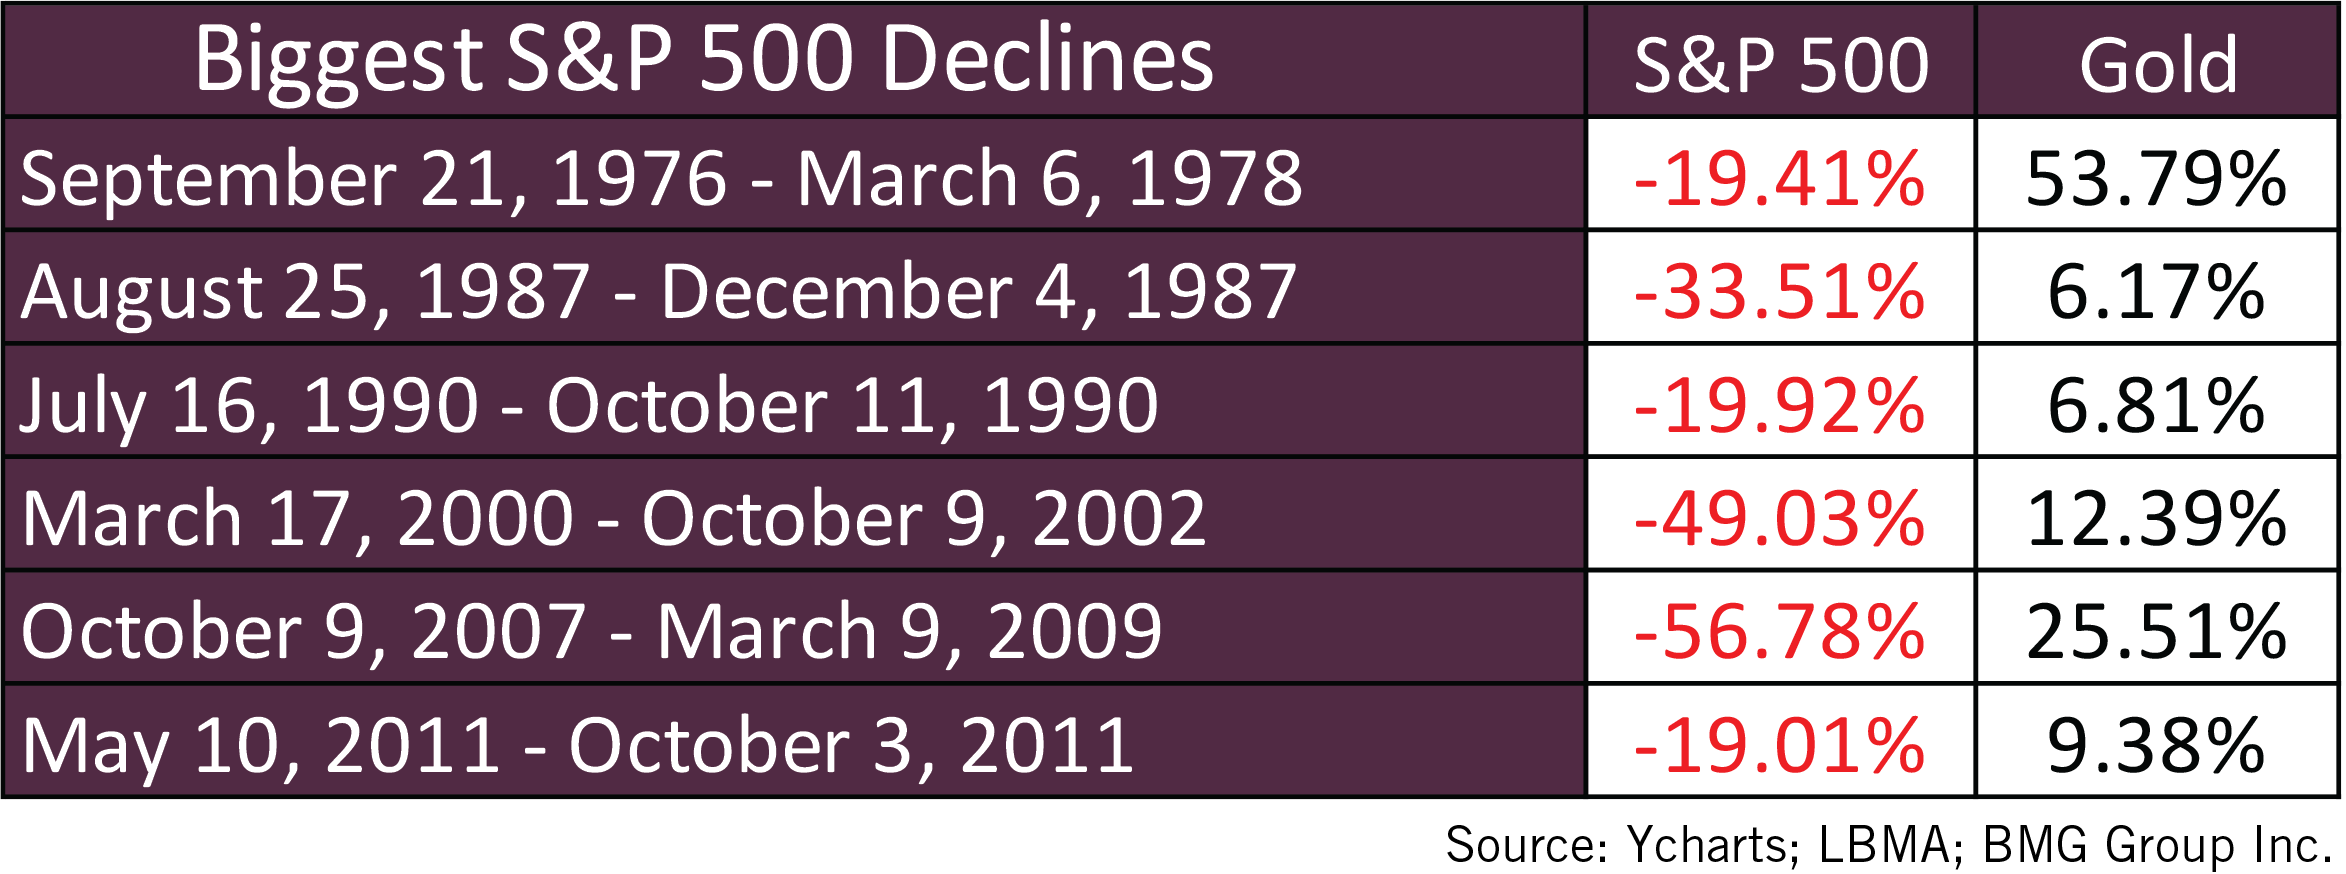
From a long-term strategic viewpoint, a 20% portfolio allocation to gold will reduce portfolio volatility and improve returns. However, during times of market instability, gold serves its primary purpose of preserving wealth better than any other asset class, as it has for the past five thousand years. It is during market downturns that gold transfers wealth.
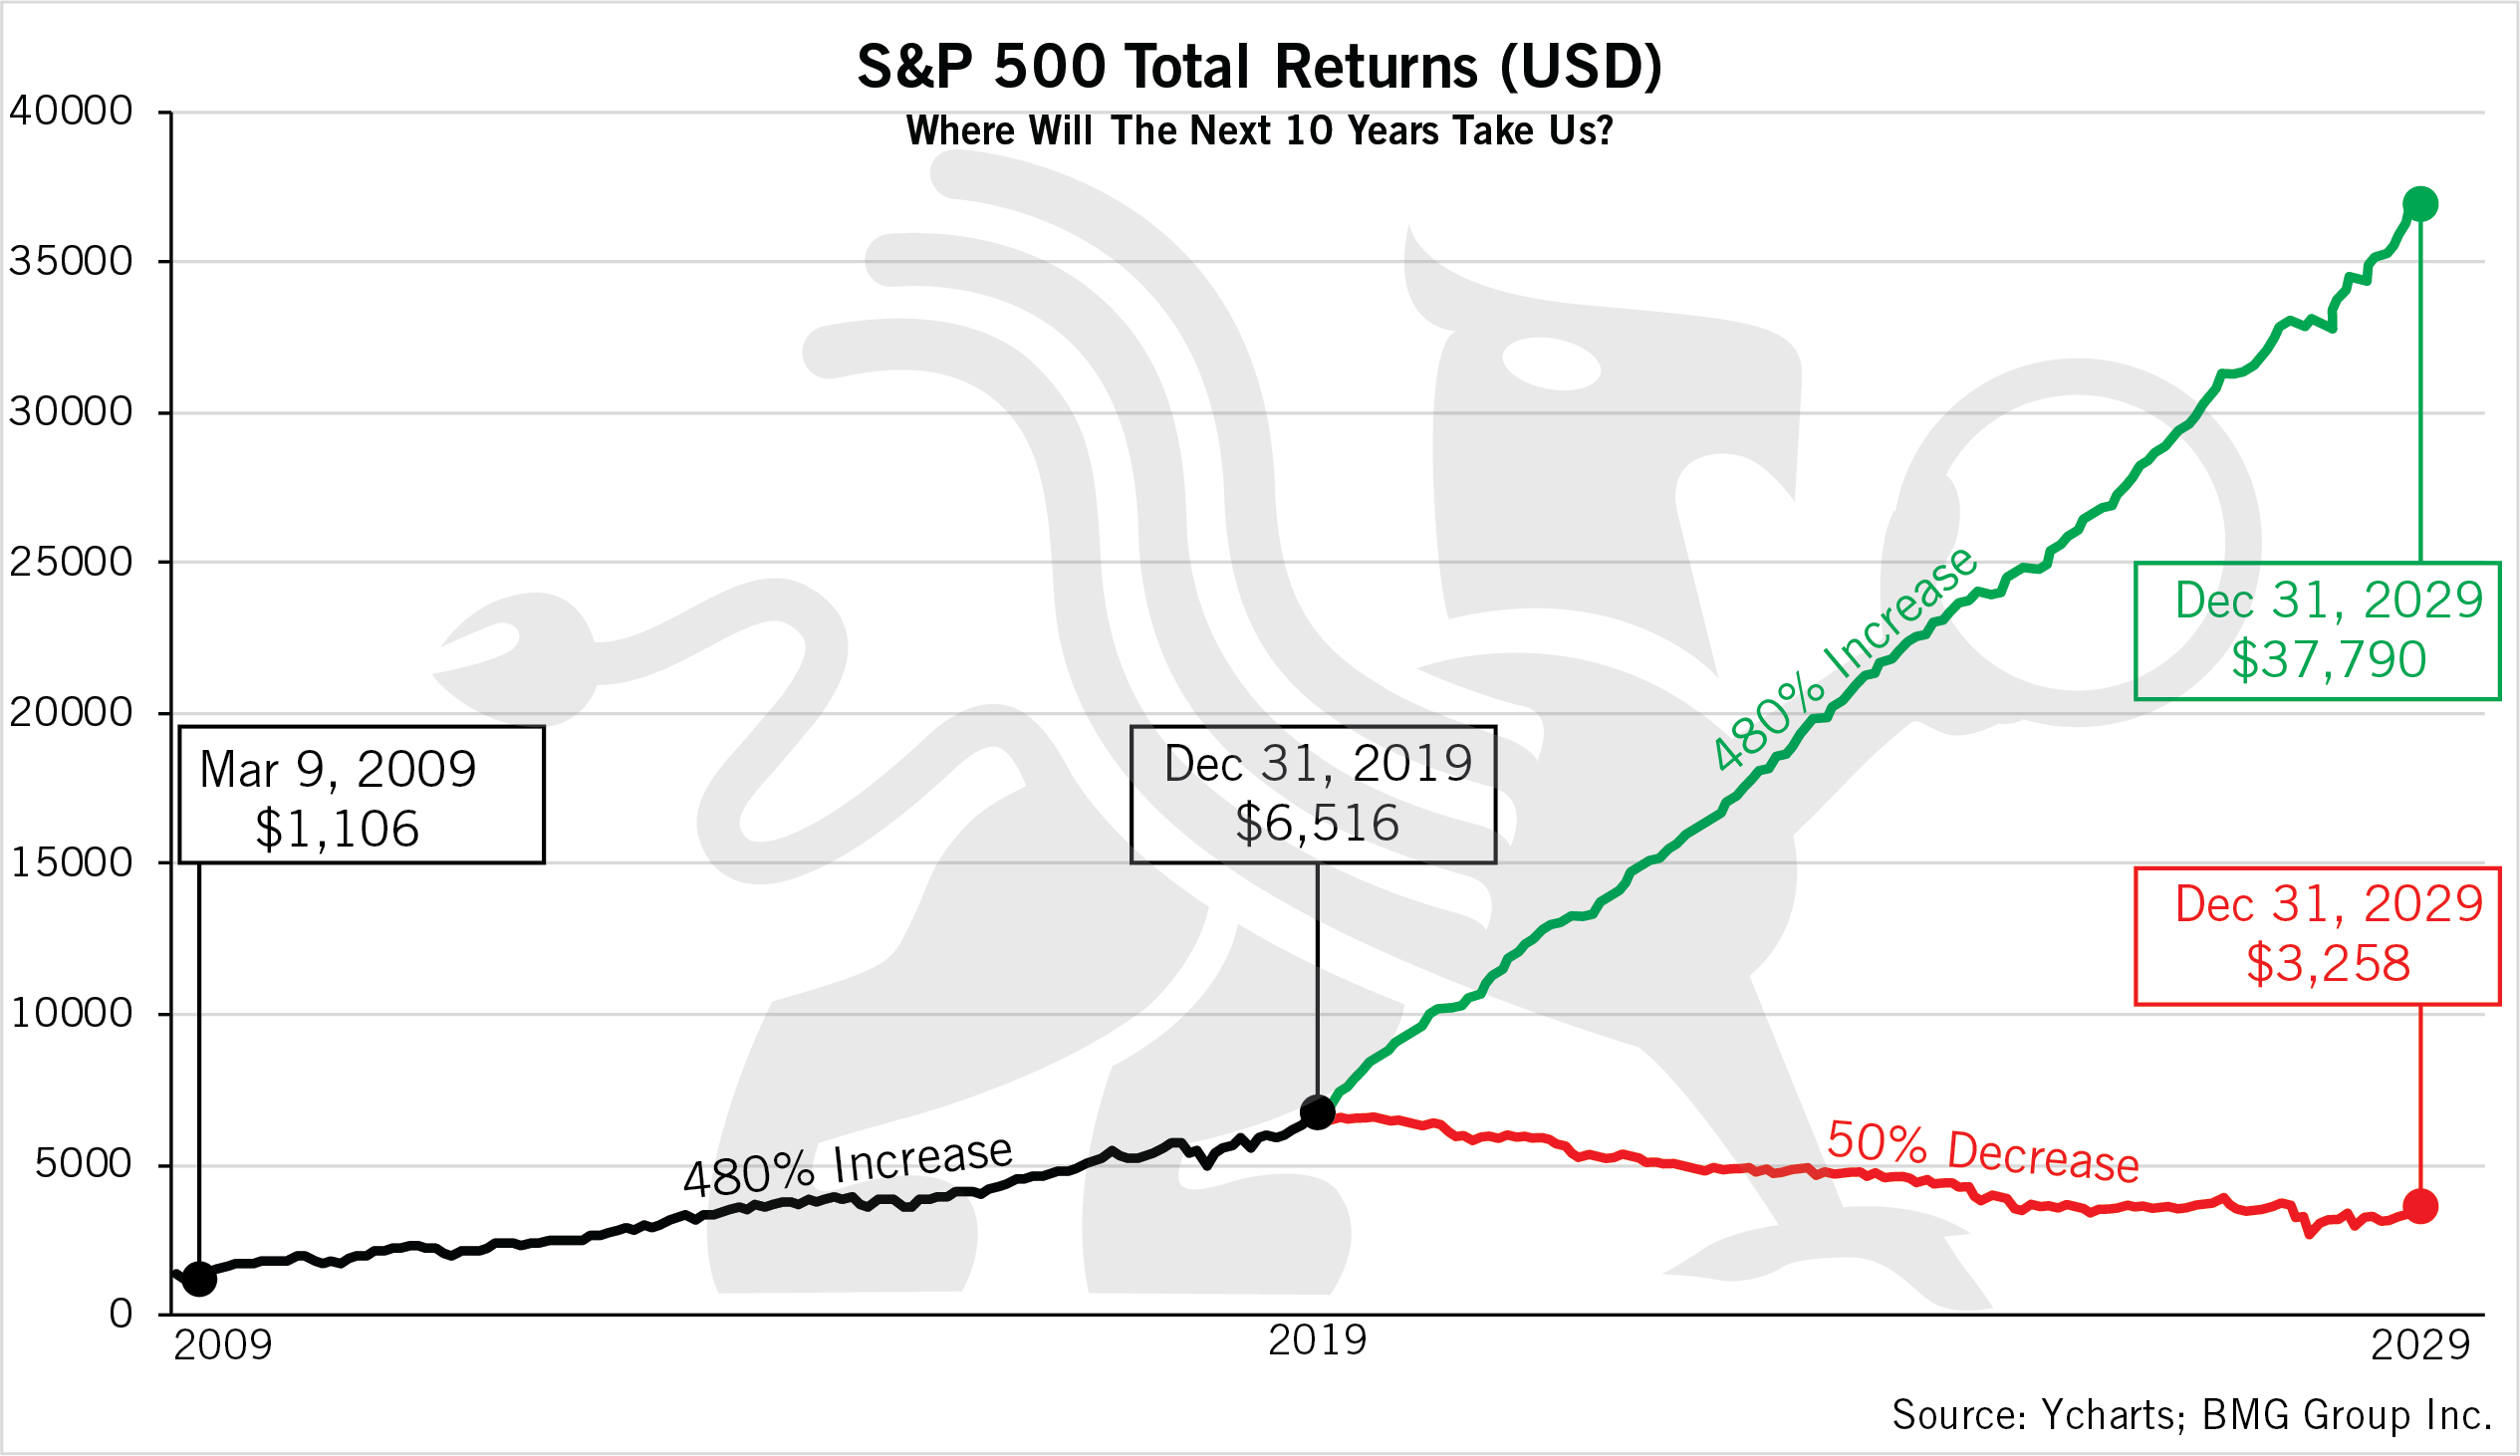
As we enter 2020, the question we have to ask is: How close to the edge of the cliff do we dare to go? Since the trough of 2009, the S&P 500 has experienced a 480% increase from $1,106 to $6,516. It may, in fact, rise some more. But is it realistic to expect the same performance during the next ten years? Can the S&P 500 reach $37,790 in total returns?
Historically, great fortunes have been made in times of market downturns by those confident enough to exit the market before the downturn, and park their money in real assets, such as gold, that preserve purchasing power, then re-enter at a significant discount to current prices. Central banks have set records with their gold purchases. Many ultra high net worth investors have already reallocated to real assets and gold.
In the current bubble environment, we at BMG have modeled a strategy that uses an initial tactical allocation of 100% to gold bullion. When the inevitable correction is complete, the strategy calls for a reallocation to a long-term balanced and diversified strategic allocation of stocks, bonds, REITs, gold and silver bullion. Only underlying funds that have outperformed their peers and their indexes for ten years were chosen.
We have back-tested this strategy as applied to the 2008 Crash, and the model generated a 25% average annual compounded return. BMG has created a Hedge Fund to follow this strategy.
I encourage everyone to take some time to do some serious soul searching on this issue.
It requires foresight, independent thought, and immense courage to swim against the tide of popular thought. But the rewards of preserving — and possibly greatly enhancing — your family’s wealth for generations will be well worth it.
In 2020, it will also will not matter if gold ends the year at $1,500 or $1,900. As I have set out in my book – it will go much higher in the future.
Thank you

Pingback: Outlook For Gold in 2020 - The Daily Coin
Pingback: Manufacturing Bits: Jan. 13
Pingback: Silver & Gold Down on Low Volume - Ed Steer's Gold and Silver Digest
Nick will be spectacularly right. Probably soon.
Pingback: Gold In 2020 & Beyond - What To Expect & Why - munKNEE.com
There is a glaring error in your S&P 500 chart. You show the close on 12/31/19 as 6,516 VS the correct number of 3,329.62.
Does this error taint your other statistics presented?
Pingback: Gold In 2020 & Beyond – What To Expect & Why – Mint Dynasty
Hi Bill,
Thank you for your comment. The S&P 500 chart is a total return chart. It represents the additional dividends that would have been included throughout the entire time period. That is why the number is much higher. You are right, the price of the S&P is only around $3,000 but it doesn’t take anything other than price into consideration, which would skew your actual returns. We believe that using total return was the correct decision to make.
Pingback: Should You Stay Fully Invested In This Environment? - munKNEE.com