Indicators Display That Markets Are Overvalued | BullionBuzz Chart of the Week
For this week’s Chart of the Week, we pulled data from 1950 to 2020 to analyze the S&P 500 price level and corporate profits after tax. As many would expect, corporate profits should be a driver of growth for publicly traded companies in terms of stock price. However, a major divergence has been occurring since 2015. Markets have been continuing to push up stock prices, while corporate profits have been stagnant. The last time such a major divergence between the two comparables occurred, was the dotcom crash.
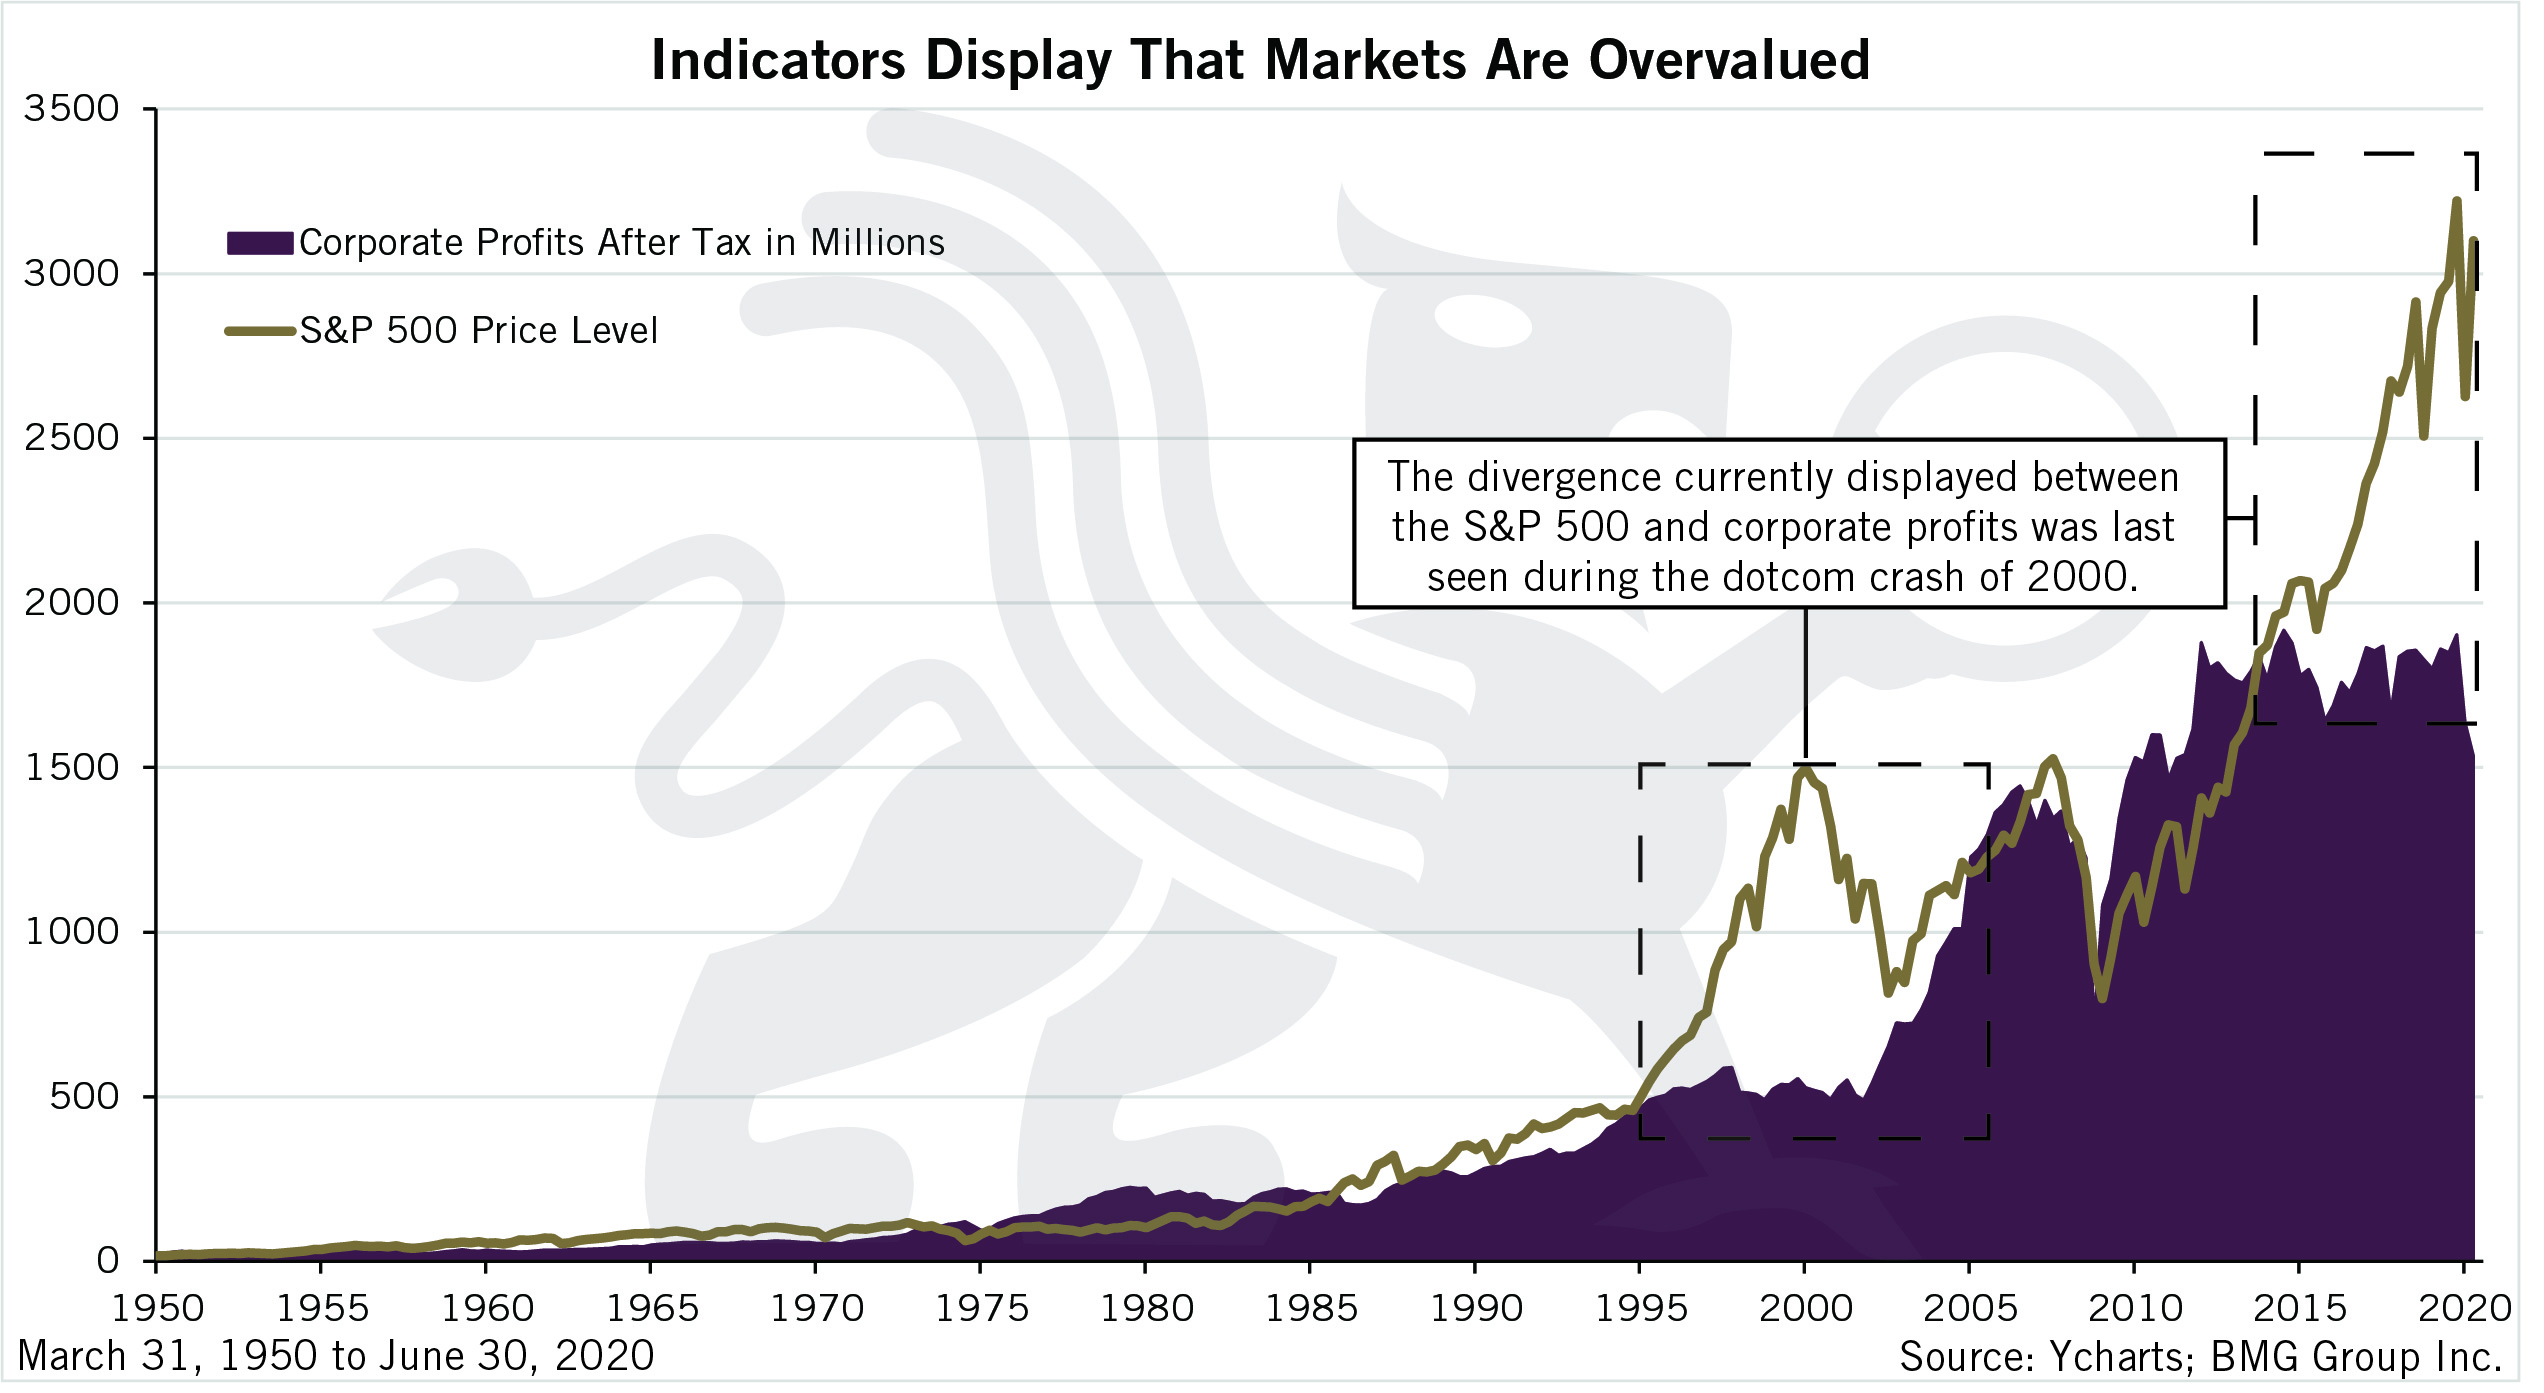
Source: Ycharts; BMG Group Inc.