Which Is Better for Your Portfolio: Mining Stocks or Physical Bullion?
To download PDF of this article
Precious metals is widely known as an asset class that, due to its negative to low correlation against traditional asset classes, can serve to preserve wealth during periods of financial distress.
With the recent moves in the price of physical gold bullion and level of market uncertainty, one of the questions on some investors’ minds is, “Am I better off investing in gold stocks (i.e., producers, miners) or in physical gold bullion itself?”
To be clear, this should never be an either/or decision. Each has its place in an investor’s portfolio. The chart below highlights the various levels of risk associated with the different ways an investor can achieve an allocation to precious metals as an asset class. As highlighted in the pyramid, an investment in gold stocks (e.g. gold producers/miners) should be undertaken as part of the growth component within an investor’s portfolio. However, an investment in physical bullion (a monetary asset), when stored on a fully allocated basis, should be treated as an alternative to cash.

That’s right: Gold should be treated as a zero-risk asset. A recent move by the Bank for International Settlements (BIS) reinforces this. The BIS helps to serve its member central banks around the world in their pursuit of monetary and financial stability. It has enforced certain laws through its Basel III reforms issued in December 2017, and fully enforced in January 2019, (paragraph 96). Central banks (including the Bank of Canada) will recognize monetary gold held in the institution’s own vaults on an allocated basis at a 0% risk weight for risk-based capital purposes.
Now that we understand how to classify the various ways one can achieve an allocation within a portfolio, we can turn our attention to the return/risk component between physical bullion and stocks. Investing in precious metals stocks can offer an attractive opportunity for investors, as the companies may benefit from operating leverage, which is the multiplier effect additional gold revenues can have on a company’s earnings as a rising gold price exceeds the company’s marginal cost of production.
However, as with any investment decision, it’s all about timing and selection. The NYSE Arca Gold BUGS Index (HUI) is one of the most popular gold indexes. It is comprised of companies involved in gold mining. The acronym BUGS stands for Basket of Unhedged Gold Stocks.
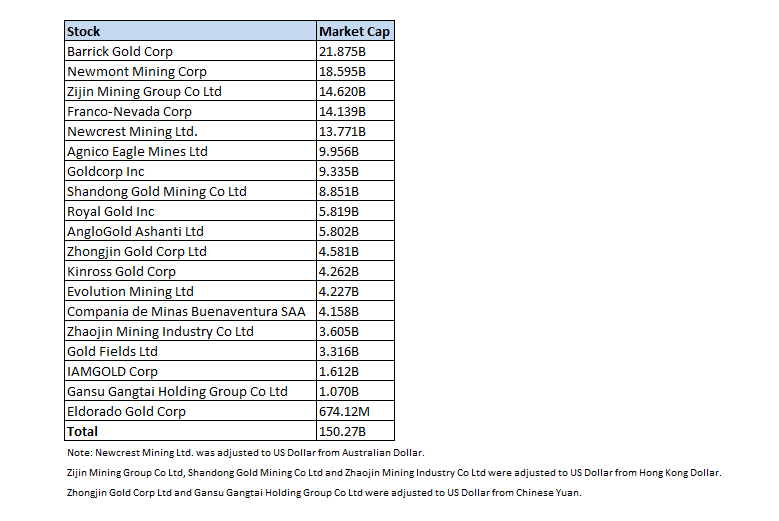
We are late in the business cycle, where fears of a severe market correction or even a recession may be warranted due to slower economic and earnings growth, rising debt burdens, trade wars, geopolitical issues; the list goes on. As previously mentioned, many precious metals investors do not draw a distinction between investing in physical bullion and an investment in precious metals stocks. The stocks have quite a different risk profile when compared to physical bullion; e.g., management, supply, hedging, liquidity, political risks, etc. They also have systematic or market risk. Exacerbating this problem is the fact that many of these companies are thinly traded and, if we add up the total market capitalization of all the world’s leading gold mining companies, they have a total market cap of approximately $150 billion. For comparative purposes, this is just a fraction of the market cap of a single company, such as Microsoft, whose market cap is around $863.6 billion.

Thus, in an equity market downturn, the stocks can greatly underperform physical bullion even if the latter is rising in price, thereby not being as effective a hedge against market tail risk activity. For example, if we look at the period of the market correction during the financial crisis from the end of [i] August 2007 to the end of February 2009, while gold in CAD terms was up around 62%, the HUI in CAD terms was down -22.95%, while the S&P/TSX was down -44.46%. Therefore, for an investor seeking wealth preservation during the broader market equity decline, the best way to have achieved that would have been by investing in physical gold bullion.
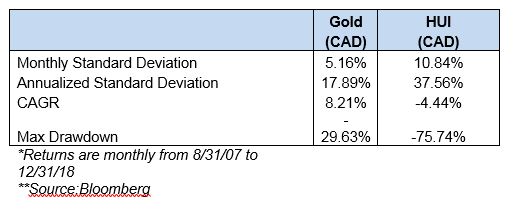
If we extend the period to include performance up to December 31, 2018, physical gold bullion in CAD terms still proves to be the better investment decision from a return/risk perspective (See Chart 1).
Chart 1

For the period, gold bullion in CAD greatly out-performed the HUI Index with considerably less volatility. The Compounded Annual Growth Rate (CAGR) for gold bullion in CAD was 8.21% versus -4.44% for the HUI Index. The maximum drawdown that an investor would have endured while invested in gold bullion would have been -29.63% versus -75.74%, as exhibited by the HUI Index.
To simplify this, if an investor had invested $1,000 at the beginning of the period, it would have grown to $2,460.76 in gold bullion. It would have grown to only $595.09 in the HUI Index.
As previously mentioned, timing and selection is very important in the world of investing. Bearing that in mind, let’s look at the performance for the same time period (August 2007 to December 2018) of some of the better known Canadian precious metals mutual funds that actively allocate to precious metals equities. For benchmarking purposes, I have measured their performance against the BMG Gold BullionFund, which is a mutual fund that only invests in physical gold bullion (stored on a fully insured and allocated basis).
Chart 2

Physical bullion as represented by the BMG Gold BullionFund materially outperformed the Canadian precious metals funds with significantly less volatility. An investment in the BMG Gold BullionFund would have returned approximately a [ii]5.02% CAGR, while all but two of the precious metals mutual funds that allocate to the stocks had negative returns.
Therefore, over the past 11 years, timing and stock selection was not of material benefit to investors who got their precious metals allocation solely by investing in those funds that allocate to the stocks.
In Q4 of last year, during the broader market equity market sell-off, we saw gold outperforming. A look at the performance between physical gold and the HUI from August 9, 2018 to February 1, 2019 shows that while gold is up 12.4%, the HUI is up 21.4%. Thus, we are seeing outperformance of roughly 1.7 times in the stocks’ favour. Will it continue? No one has a crystal ball, but the broader markets are still, by historical measures, greatly overvalued, with the possibility of further downside from present levels. Thus, from a risk management point of view, it might be a good strategy to have an allocation to physical bullion with a view to mitigating the volatility and underperformance that precious metals stocks can exhibit, given their past performance during the latter stages of the business cycle.
In fact, one can argue that it might even be meritorious from a tactical perspective to be currently overweight physical bullion versus precious metals stocks if your view is to hedge your portfolio against the possibility of a further market decline. Once the market has bottomed and is in recovery mode, then you can tilt your allocation to be overweight stocks versus physical bullion, and benefit from the leverage that stocks can exhibit to the price of physical gold bullion as it heads higher.
Please feel free to reach out to me at r.seale@bmg-group.com if you have any questions.

Ryan Seale, CIM
Director, Global Business Development
BMG Group Inc. | 280-60 Renfrew Drive, Markham, ON CANADA L3R 0E1
Direct: 905:415.2956 | Main: 905.474.1001 | Toll Free: 1.888.474.1001 | Fax: 905:474.1091
Email: r.seale@bmgbullion.com
[i] Returns calculated using monthly data.
[ii] BMG Gold Bullion Fund returns derived using LBMA PM Fix monthly date backed off by MER approximation to simulate what fund returns would have been for the period.
