Lest We Forget, Times of Market Distress
by Ryan Seale
This month, October, is the 10-year anniversary of the S&P 500 Index’s gut-wrenching descent towards the ultimate bottom, which it reached in March 2009 (a correction of some -57%). Many of the advisors that I have talked to readily admit that having conversations with clients during times of serious financial distress is one of their biggest fears. Are you prepared for that conversation? Suppose there was a way that could help mitigate the need for these types of unpleasant client conversations the next time around?
As of September 30, the US markets as measured by the S&P 500 Total Return Index are up 14.24%. However, for many Canadian investors (unless hedged) because of the strength of the Canadian dollar, their return for having an allocation to US equities is around 6.04%. In addition, if these foreign currency gains/losses were not enough, investors seeking to achieve an investment return that will keep abreast of inflation also have cause to be concerned given some of the high valuation metrics that we are seeing across the equity markets, and possible market corrections.
One of the key tenets of modern portfolio theory is that when given a choice, rational investors would always opt for a portfolio that would offer a higher return for the same risk or, for the same return, a portfolio with lower risk. The magic in this concept lies within the notion of portfolio diversification. By diversifying your investments among various asset classes with varying degrees of correlations to each other, you are ensuring that you will be getting some positive portfolio performance, in spite of what is going on in the world around you, from a financial or economic perspective.
What if there was an asset class that, on an historical basis, has been a good investment in terms of maintaining an investor’s purchasing power in Canadian dollar terms. Also, because of its negative correlation towards traditional asset classes, this investment typically lowers portfolio volatility, which can lead to outperformance as compared to equities during times of financial distress.
Sounds too good to be true? Well, this asset class that I refer to is none other than gold bullion.
For simplicity, I have kept the number of asset classes involved at two, as the investigation is geared towards maximizing growth allocations within a typical MFDA relationship.
Have a look at the numbers below:
Chart 1
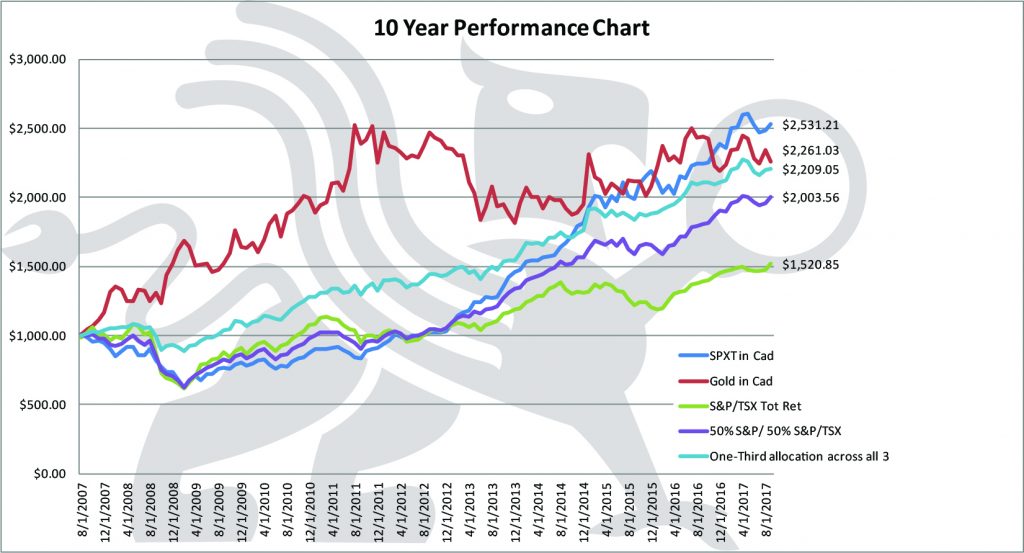
Data as at September 29, 2017. Source: Bloomberg
Chart 1 shows that, if you invested $1,000 ten years ago into a 50% allocation within the S&P 500 Index and 50% into the S&P/TSX Index, it would have grown in Canadian dollar terms, on a total return basis, to $2,003.56. The same investment allocated to gold bullion would have grown to $2,261.03 over the same period. However, if we had allocated across the two asset classes (Equities/Precious Metals) wherein each investment represented one-third of the investable funds, this investment would have grown to $2,209.05.
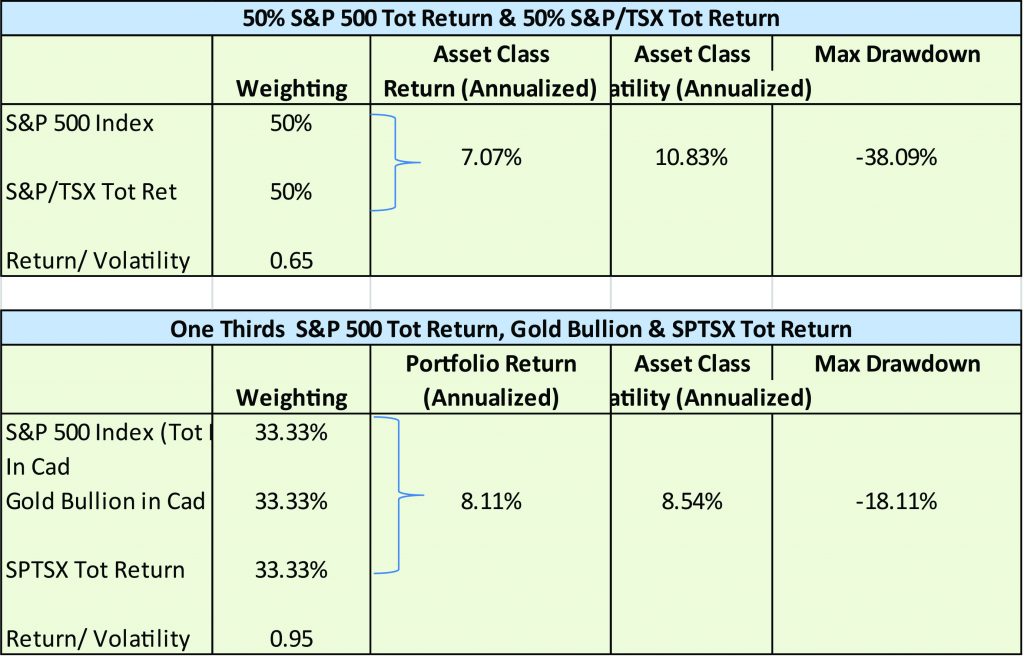
In addition to generating a higher rate of return for the investor of 8.11% (compared to 7.07% from that of 50% S&P Index & 50% SPTSX Index alone) in Table 1, the amount of portfolio risk when combining these two asset classes was reduced to 8.54% from 10.83% with a material reduction in the maximum drawdown from -38.09% to -18.11%. Therefore, by including gold bullion as part of your portfolio growth component, you would have improved the risk/return metrics against those of just having your growth component in equities. This is diversification at work, folks!
Table 1
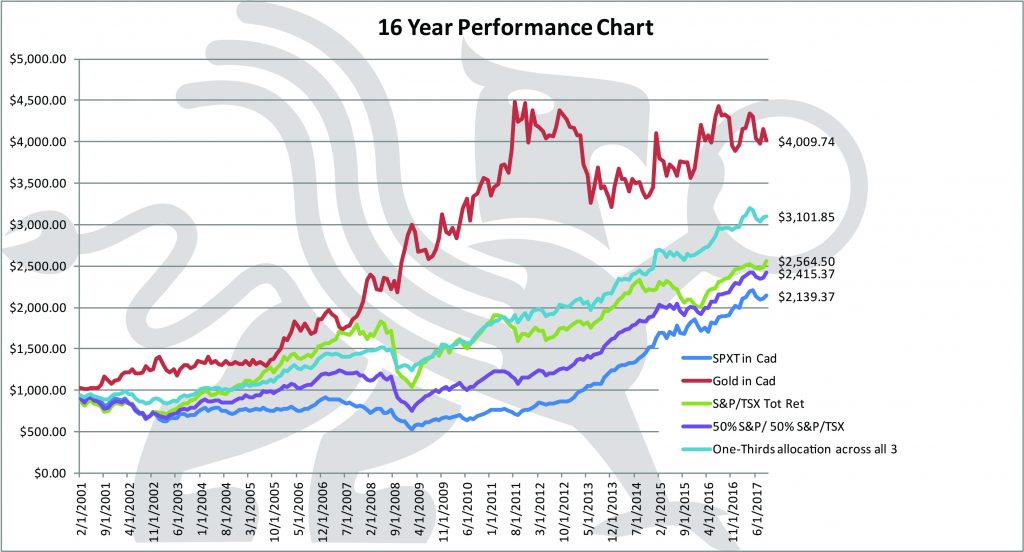
Let’s look at a longer timeframe to investigate this premise. Chart 2 shows how a $1,000 investment would have grown in Canadian dollar terms from February 2001 to September 29, 2017. The allocation to 50% S&P 500 Index and 50% SPTSX Index would have grown to $2,415.37. The same investment allocated to gold bullion would have grown to $4,009.74 over the same period.
Chart 2
Data as at September 29, 2017. Source: Bloomberg
Table 2
However, if we had allocated across the two asset classes, wherein each allocation represented one-third of the funds, this investment would have grown to $3,101.85.
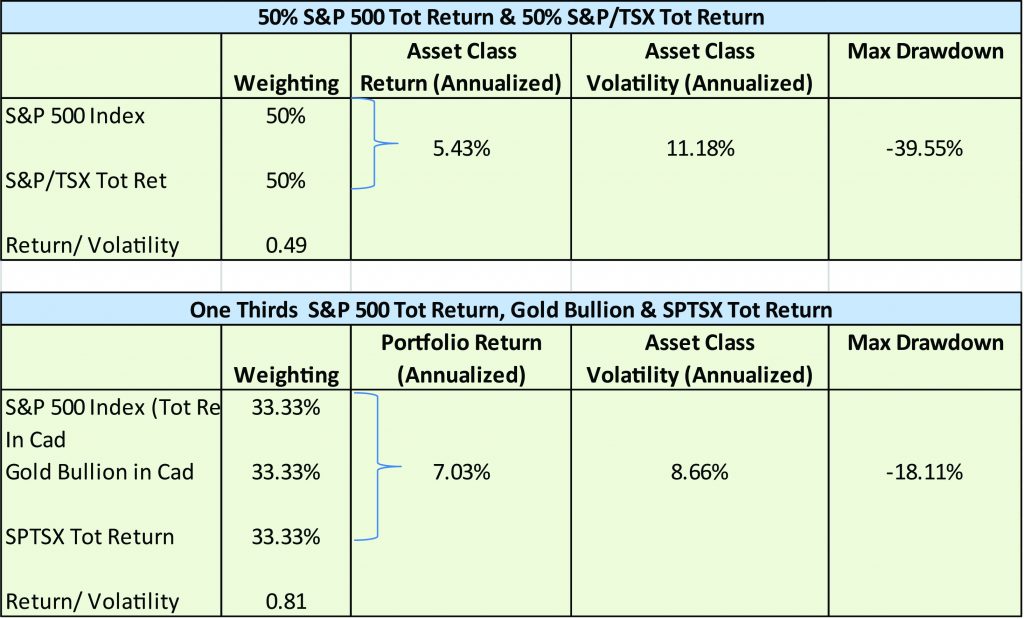
By adding the one-third allocation to gold bullion, the volatility of the combined portfolio is more favourable to the one exhibited by equities by themselves (from 11.18% to 8.66%), with a return improved from 5.43% to 7.03%. In addition, an investor having this combination would have seen the maximum drawdown reduced from -39.55% (from 50% S&P Index, 50% S&P/TSX equity allocation) to -18.11%.
Therefore, far from being just a barbarous relic with no use within the context of portfolio management, this demonstrates that having an allocation to gold bullion may greatly improve the risk/return metrics of the growth component of investors’ portfolios. In doing so, this adheres to some of the fundamental assumptions within modern portfolio theory.
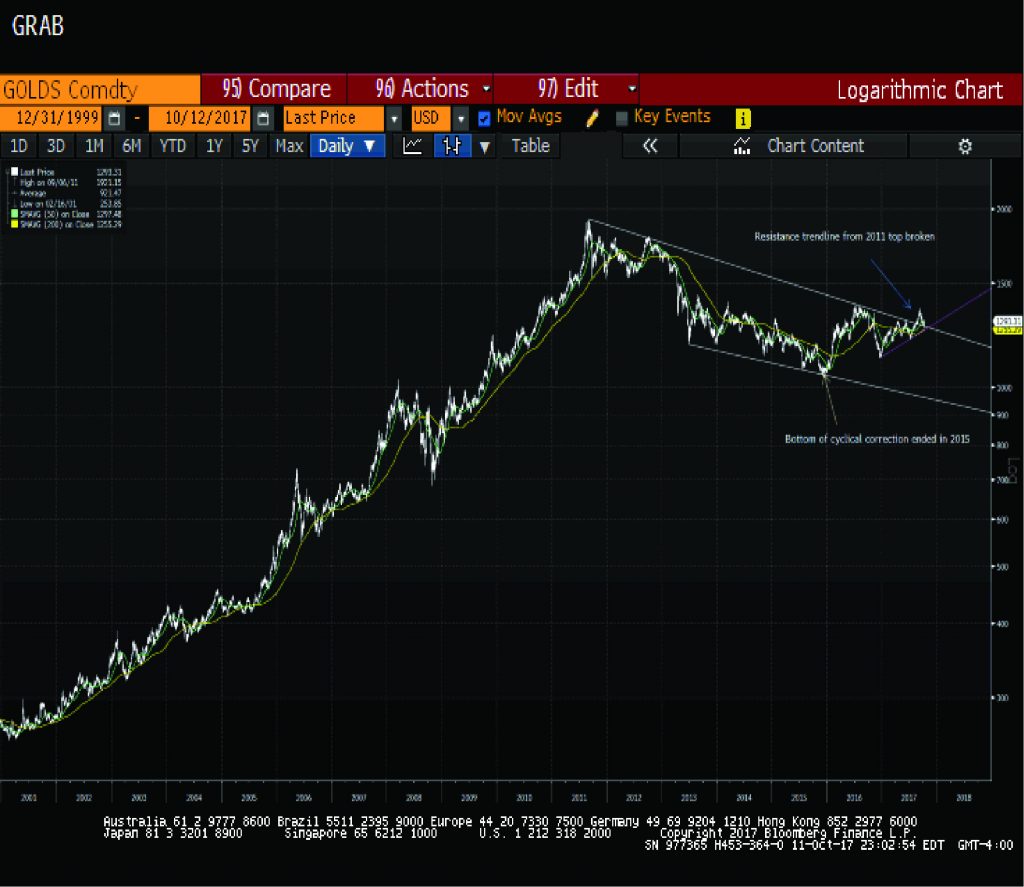
What lies ahead for the shiny yellow metal, you ask? Well, a picture is worth a thousand words.
Data as at October 12, 2017. Source: Bloomberg
 Ryan Seale, CIM
Business Development Manager
BMG Group Inc. | 280-60 Renfrew Drive, Markham, ON CANADA L3R 0E1
Direct: 905:415.2956 | Main: 905.474.1001 | Toll Free: 1.888.474.1001
Fax: 905:474.1091 | Email: r.seale@bmgbullion.com
To download a PDF version of this article

