Historical Performance of Precious Metals (USD) | Chart of the Week
We highlight the growth of $1 from 1971 to 2020 in this Historical Performance of Precious Metals (USD) chart of the week.
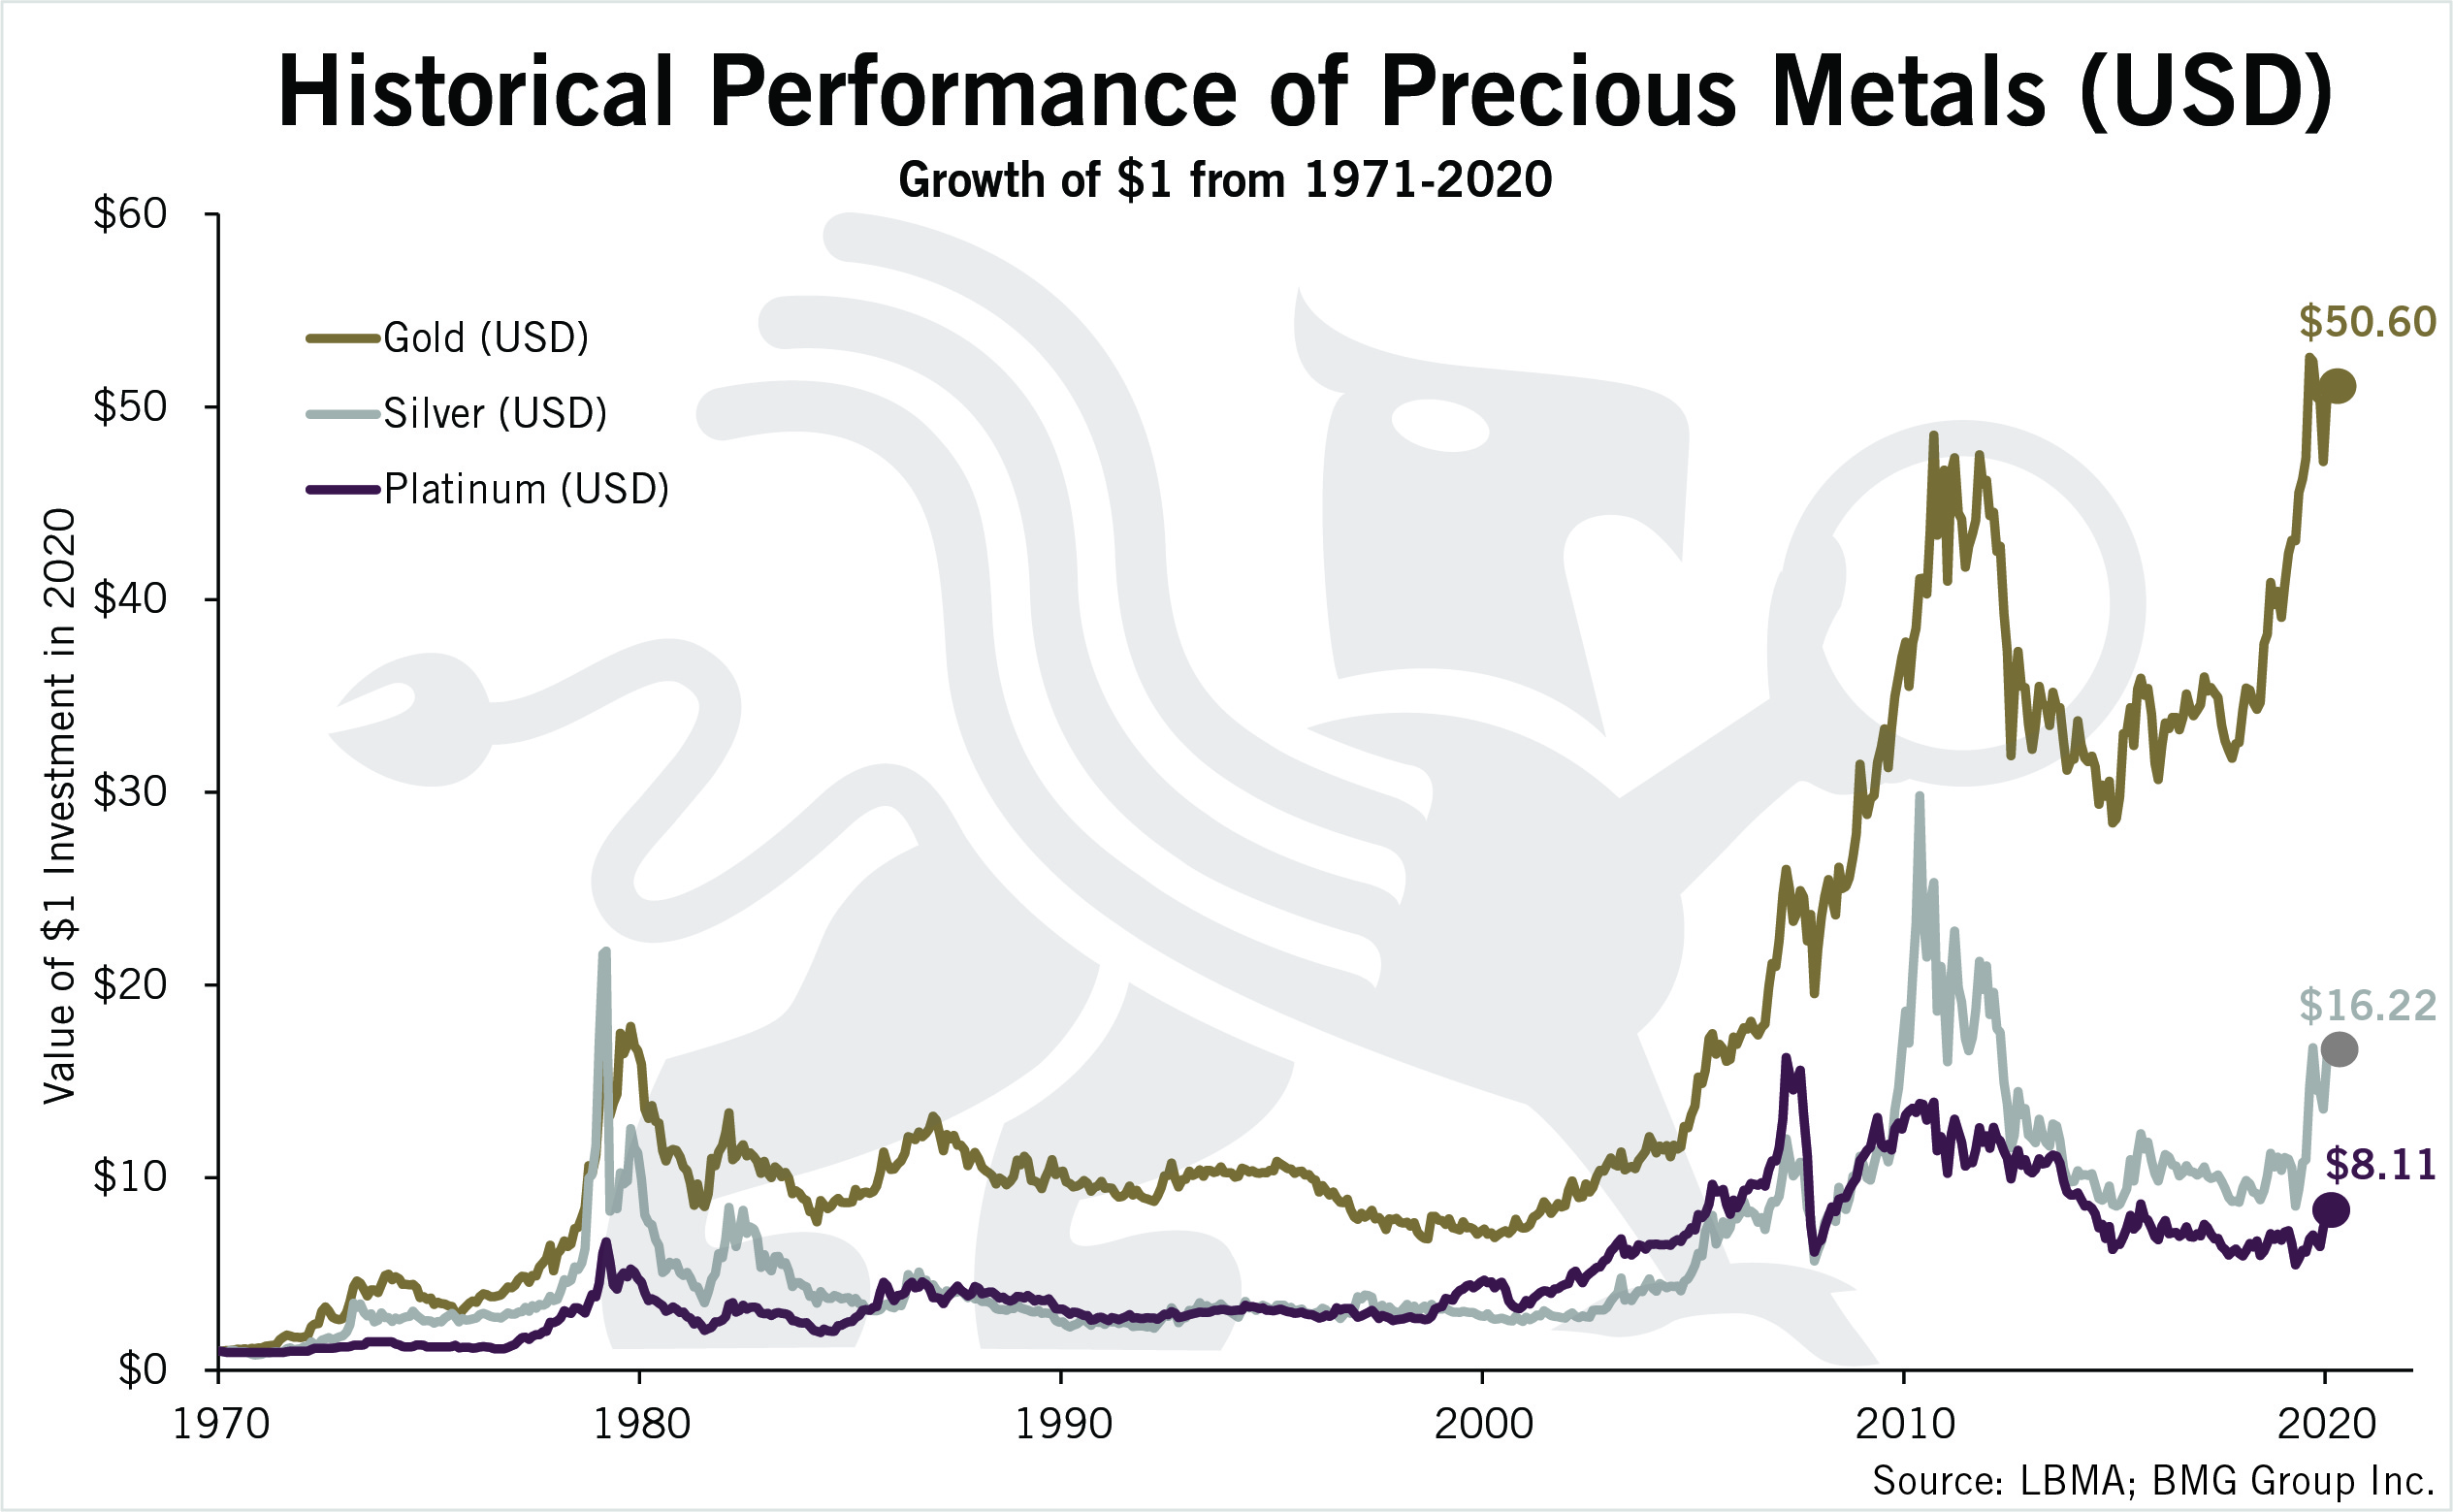
Source: LBMA; BMG Group Inc.

We highlight the growth of $1 from 1971 to 2020 in this Historical Performance of Precious Metals (USD) chart of the week.
Source: LBMA; BMG Group Inc.