Gold’s Golden Cross | BullionBuzz Chart of the Week
This week’s BullionBuzz Chart of the Week, shows that the golden cross has taken place in gold’s market. 20-Day EMA crossed over 50-Day EMA. The golden cross is a technical chart pattern indicating the potential for a major rally. The chart shows that the golden cross occurred only twice in 2019. This might be a great opportunity for investors to move their assets from a volatile market into gold.
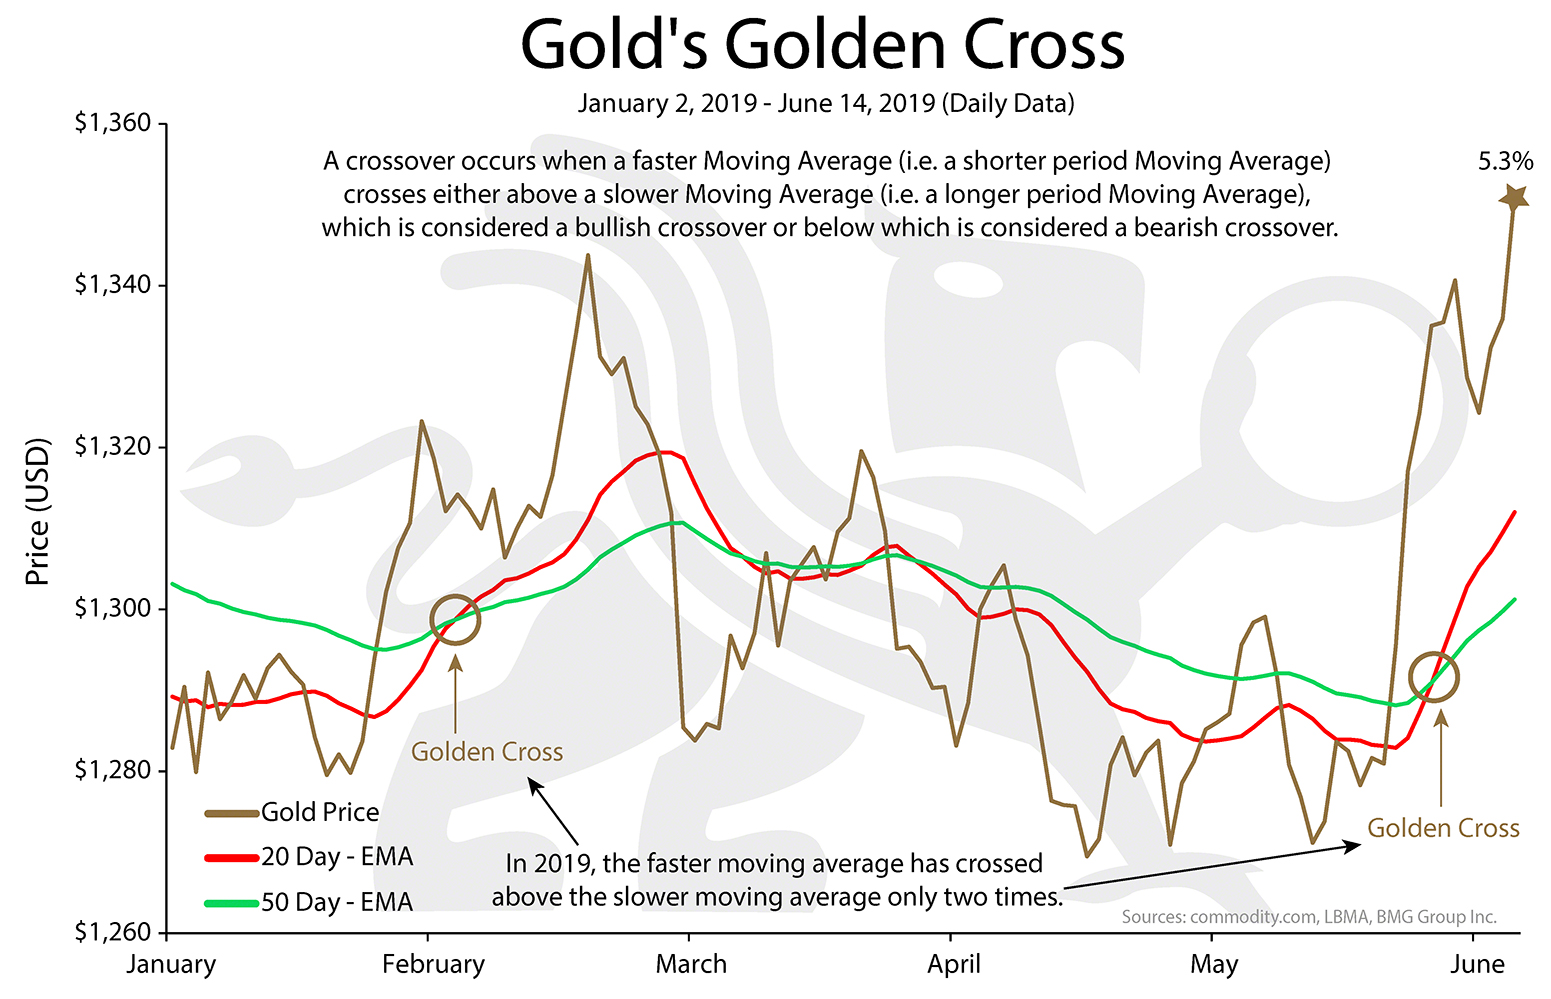
Source: commodity.com; LBMA; BMG Group Inc.