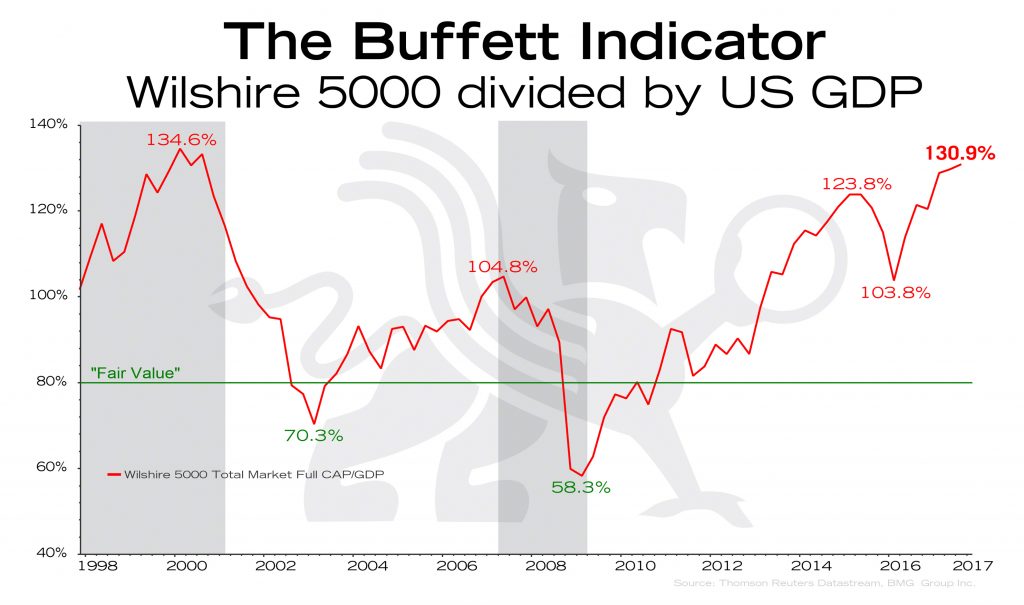
The Buffet Indicator – Revised | BullionBuzz Chart of the Week
Wilshire 5000 divided by US GDP
Source: Thomson Reuters Datastream; BMG Group Inc.
Source: Thomson Reuters Datastream; BMG Group Inc.
BMG employs cookies to optimise site functionality and enhance your user experience. By continuing to browse this site, you acknowledge and accept our use of cookies.
Websites store cookies to enhance functionality and personalise your experience. You can manage your preferences, but blocking some cookies may impact site performance and services.
Essential cookies enable basic functions and are necessary for the proper function of the website.
Marketing cookies are used to follow visitors to websites. The intention is to show ads that are relevant and engaging to the individual user.
Google Maps is a web mapping service providing satellite imagery, real-time navigation, and location-based information.
Service URL: policies.google.com (opens in a new window)
LinkedIn Insight is a web analytics service that tracks and reports website traffic.
Service URL: www.linkedin.com (opens in a new window)
You can find more information in our Cookie Policy and .

