Gold Outperforms Berkshire Hathaway
Warren Buffett, also known as the Oracle of Omaha, controls and provides leadership for Berkshire Hathaway (Berkshire), a diversified holding company and one of the world’s largest multinational conglomerates that wholly owns GEICO, Duracell, Dairy Queen, BNSF, Lubrizol, Fruit of the Loom, Helzberg Diamonds, Long & Foster, FlightSafety International, Pampered Chef, and NetJets, and also owns 38.6% of Pilot Flying J and 26.7% of the Kraft Heinz Company. It also has significant minority holdings in American Express (17.6%), Wells Fargo (9.9%), The Coca-Cola Company (9.4%), Bank of America (6.8%), and Apple (5.22%). Since 2016, the company has acquired large holdings in several major US airline carriers and is currently the largest shareholder in United Airlines and Delta Air Lines, and one of the top three shareholders in Southwest Airlines and American Airlines.
Buffett is best known for his value-investing approach and is considered one of the best investors in the field. This article studies Berkshire’s performance next to that of gold. First, a comparison will be made between value stocks and growth stocks in order to determine the superior investing strategy. Second, Berkshire will be analyzed against the Russell 3000 Total Return Value Index in order to determine if the company managed to outperform a well-respected benchmark. Finally, gold will be compared with Berkshire in order to help investors navigate through the current economic uncertainty.
Value Stock Vs Growth Stocks
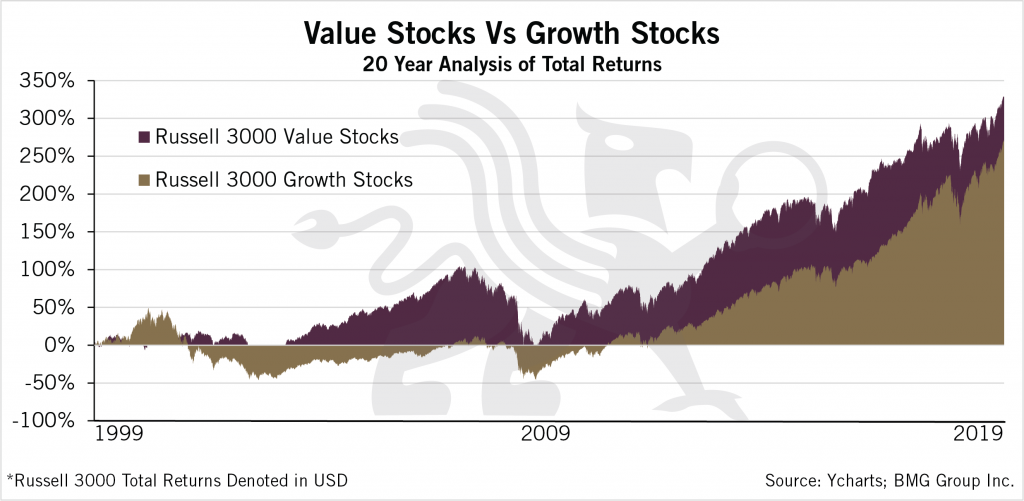
Chart 1 indicates that value investors have significantly outperformed growth investors when comparing the Russell 3000 total return values for the respective investment methods. Over the 20-year time horizon, the Russell 3000 Value Total Return Index netted investors 329%. This was significantly greater than the Russell 3000 Growth Total Return Index, which provided investors with a 270% return over the same time frame. The chart shows that value investing, one of the most popular strategies within the financial industry, provides superior returns in comparison to growth-based stocks.
Berkshire Hathaway Vs Value Stocks
It is interesting to note the performance of Berkshire in comparison to the value index. Berkshire succeeded in outperforming the index; however, it fell short of investors’ expectations. Chart 2compares the performance of Berkshire and the Russell 3000 Value Total Return Index. Throughout the time period, Berkshire returned 385%, which surpassed the return of the value index by 56%. However, over a 20-year horizon, Berkshire only managed to beat the index by 2.8% a year.
As discussed, Buffett is one of the greatest value investors of all time but becoming a Class-A shareholder in his company comes with a hefty price tag of over US$340,000 per share. For a portfolio performance increase of 2.8%, compared to the Russell 3000 Value Index, that price tag is out of reach for most investors. Furthermore, if Buffett was only able to achieve 2.8% greater than the index on an annual basis, this leaves little room for investors to profit from his stock selection. We can only imagine how difficult it would be for the majority of investors to outperform Buffett on any sustained basis.
Now let’s turn to an alternative investment with large returns that outperforms the typical investing in an index.
Gold Vs Berkshire Hathaway
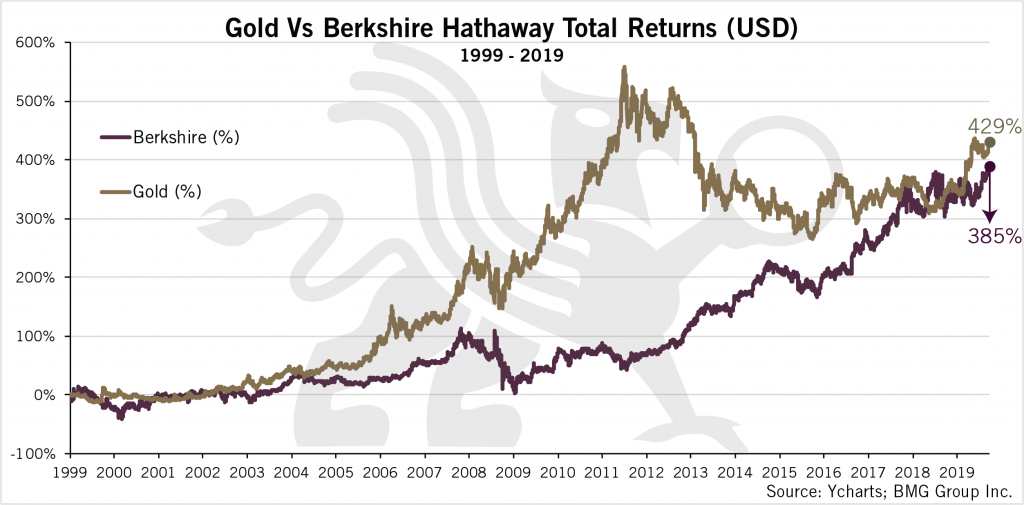
Using the same time horizon as in our analysis above, Chart 3 evaluates the performance of the gold spot price and Berkshire. Buffett has been outspoken regarding his view that gold is a “bad investment.” In one respect it is true, but it is because, according to the Bank of International Settlements and the Federal Deposit Insurance Company, gold is a “zero risk monetary asset equal to US dollars and US Treasuries,” which I elaborated on in an article written in 2015. Even if you consider gold as an investment in comparison to Berkshire, gold has outperformed, as it returned 429% compared to Berkshire’s returns of 385%. This indicates that gold outperformed both value investing and growth investing indexes, as well as Berkshire, throughout the investment period. The importance of a long-term time horizon cannot be understated. The 20-year time horizon allows the last two market cycles to be evaluated, which helps determine the performance of an asset class regardless of where we lie within the economic cycle. As shown, after experiencing two full market cycles, gold has managed to outperform its peers. Considering the existing economic conditions and the looming triple bubble in real estate, stocks, and bonds, gold should be regarded as an addition to every investor’s portfolio due to its strong long-term performance and additional diversification benefits that reduce volatility and improve returns.
Many analysts and economists are anticipating a market decline that is expected to be larger than the 2008 crash. Some believe that this bear market could lead to even steeper declines than the 1929 stock market crash. Considering the condition of the economy, at this rate there is a higher probability of a downturn than a continued bull market. The markets have managed to reach new highs amid trade tensions and quantitative easing by the Federal Reserve, which would imply that we are experiencing a bubble in the markets. Under these conditions, it is important to evaluate the performance of both gold and Berkshire during market declines.
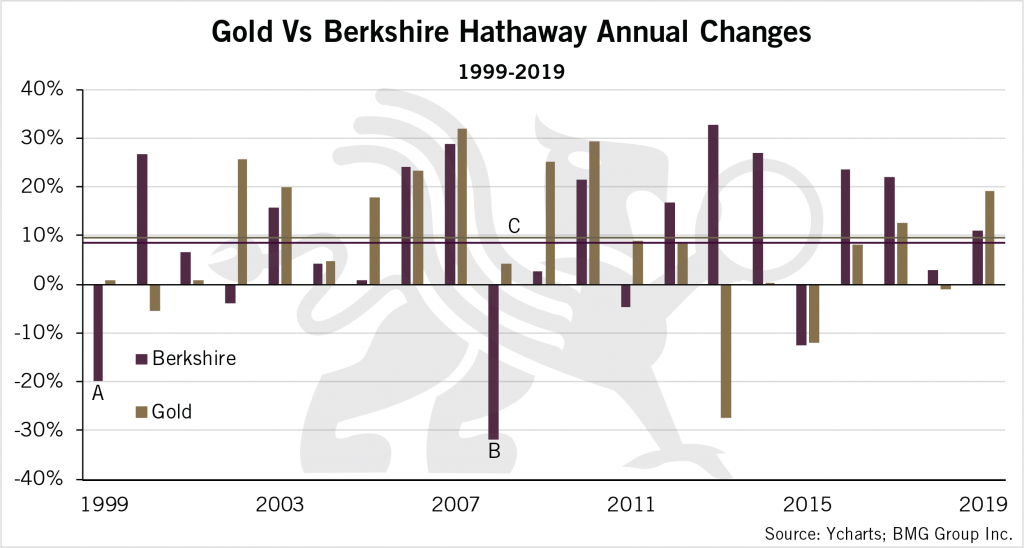
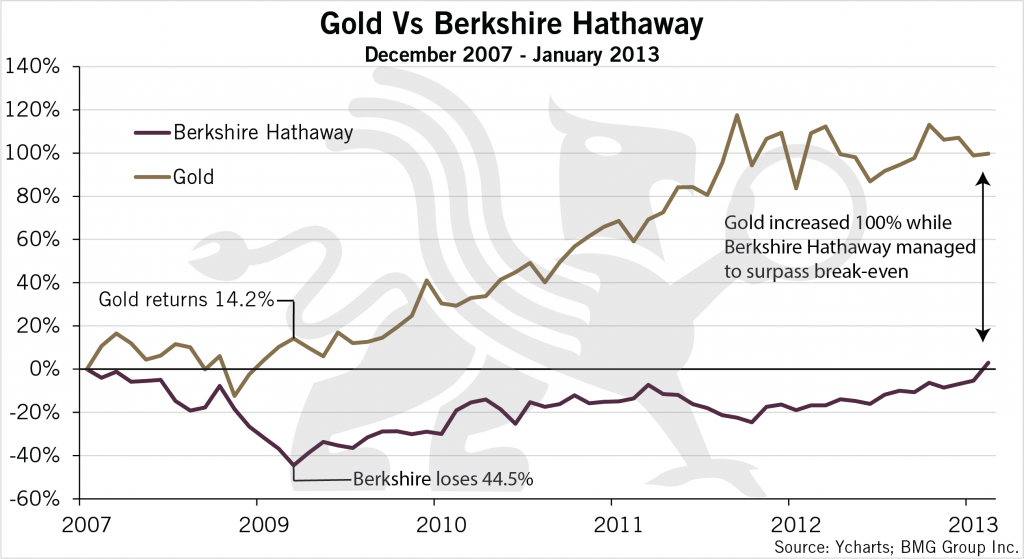
Chart 4 displays the annual changes in price for both Berkshire Hathaway and gold. The main points of emphasis are placed into sections A and B which focus on the performance of the respective assets during recessionary importance. Section A will be represented in chart 5, whereas section B will be represented by chart 6.
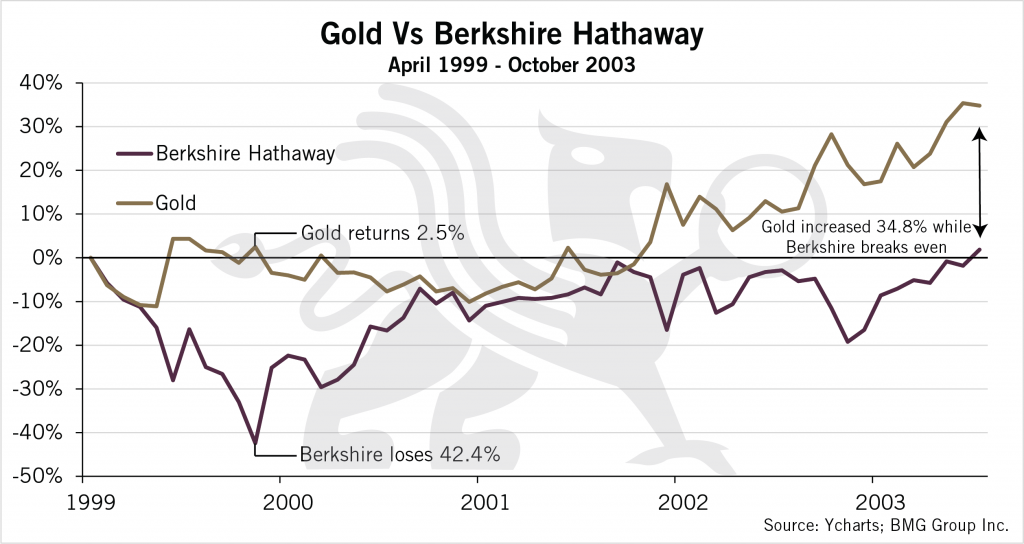
On the precipice of the dot-com crash, Berkshire’s share price peaked at $76,400 in April of 1999. Berkshire experienced a very rapid decline compared to other indexes, declining to $44,000 in February of 2000 which represents a 42.4% decline in value. Although Berkshire recovered a significant amount of their capital back the following year, they didn’t manage to break-even again until October of 2003. This implies that Berkshire investors were without profit on their investment for 4 years and 6 months.
On the contrary, gold displayed phenomenal returns throughout the same time frame. Gold started at $286.60/ounce and had increased to $293.65/ounce, while Berkshire had experienced a 42.4% decline in value. This implies that gold experienced a 2.5% increase which would have provided investors excellent protection of capital during the crash. However, the sheer power of gold is displayed when evaluating the 4-year,6-month time frame it took for Berkshire to break-even. On October of 2003, gold had appreciated to $386.25/ounce which represents a 34.8% increase in value, while Berkshire had just managed to surpass break-even again.
Additionally, prior to the 2008 financial crisis, Berkshire peaked at $141,600 in December of 2007. Once again, Berkshire experienced a rapid decline in share price during the recession as share prices decreased to $78,600 in February of 2009. This indicates that investors would have lost 44.5% of their capital invested in a little over one year. The true damage of the recession is witnessed by the break-even duration for Berkshire as investors wouldn’t have achieved break-even until January of 2013 which surpasses the break-even time required after the 1999 crash.
How did gold perform during the exact same time frame? Gold started at $833.75/ounce and increased to $952/ounce which represents a 14.2% increase. Yes, you read that correctly. While Berkshire experienced a 44.5% decline in share price, gold continued to provide investors with excellent returns of 14.2%. However, the true power of gold in once again displayed when evaluating the break-even time frame experienced for Berkshire. By the time Berkshire had achieved break-even again in January of 2013, gold continued its meteoric rise to $1,664.75/ounce which represents a 100% increase in value for holders of gold. An evaluation of current economic conditions warrants concerns that we are on the precipice of a bubble once again. Our analysis of the last two recessionary periods identifies that gold provides superior returns compared to the greatest investor during times of economic uncertainty.
In conclusion, the final analysis over the time clearly illustrates that investing in gold provides superior returns in comparison to value and growth stocks. Warren Buffett’s Berkshire Hathaway outperformed its respective index as well as growth stocks, however it could have performed even better with gold. Gold is being more and more appreciated by traditional investors, obviously because gold unequivocally secures the most superior returns. It is evident more than ever, that the past performance and past results in the current global financial markets cannot produce desired future results. and continue to slide downward over time.
The most important fact in today’s market is that traditional investments are neither balanced nor fully diversified. They typically omit one of the best-performing asset class – gold.
Today many of the world’s leading financial experts believe that the next correction will be much worse than the 2008 Crash. At the same time, we are in the early stages of seeing a massive surge of gold price from the bottom of $1,060.20 in 2015 into the $1,580 today.



Pingback: A Tale of Two Buffetts - SendGold
Pingback: A Tale of Two Buffetts - Rush Gold Global