Gold In A Portfolio | Portfolio Analyzer | Chart of the Week
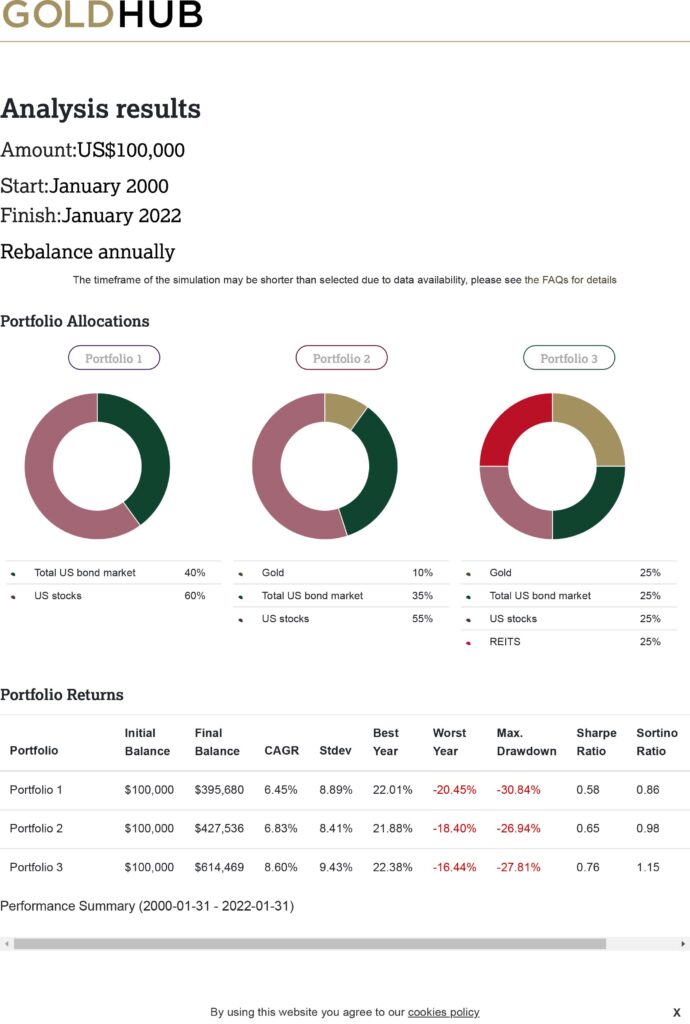
This chart is an example of a portfolio for the period January 2000 to January 2022. The first, is using the traditional 60:40 allocation to stocks and bonds. The second is showing a 10% gold allocation with a corresponding reduction in bonds, while the third, is showing 20% allocation to Gold, Bonds and REITS with a 40% in stocks. All portfolios used market indexes and no attempt was made on specific investments which could result in considerable variations. In addition, no attempt at market timing was made by buying low and selling high.
For $100,000 investment, Portfolio 1 grew to $395,680, Portfolio 2 to $435,499 and Portfolio 3 to $585,900.

Source: GoldHub

