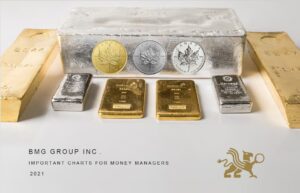
The 2021 BMG Chartbook is out with all the latest charts that would take several books and hours to explain in words.
A picture is worth a thousand words
Henrik Ibsen
BMG Group believes that the best way to help investors, advisors and asset managers understand the role of precious metals in a truly diversified portfolio is to illustrate the all-important research and data graphically.
The BMG Chart Book contains over 50 charts that deliver information instantly that would take several books and hours to explain in words. We believe that this is the best way to deliver accurate, reliable and clear-cut insights to the spectacular benefits of adding precious metals to a portfolio.
Over the last twenty years, gold has yielded an average of 11.49% per annum in all currencies, and silver has yielded 11.93% per annum. In 2020, silver was the best-performing asset class, yielding 46.8%, and gold was the third-best asset class, yielding 24.2%.
From 2000, to the end of 2020, gold bullion has outperformed all international equity indexes in the respective local currency. In 2020, gold had better returns than all but four of the DOW components; only three Dow components had lower volatility.
The value of adding precious metals to a portfolio has never been higher. Adding 10% in gold bullion to a standard 60/40 portfolio increases the compound annual growth rate from 6.59% to 7.07%, while increasing the Sharpe ratio from .61 to .70. Adding 20% in gold bullion to the portfolio increases the compound annual growth rate from 6.59% to 7.52%, while increasing the Sharpe ratio from .61 to .77.
BMG Group provides investors with a secure, convenient way of acquiring physical bullion for capital preservation, long-term appreciation, portfolio diversification and portfolio hedging purposes. The bullion is always valued at Net Asset Value, without any discount or premium.
Every picture tells a story!
CHAPTERS INCLUDE:
History of Gold (Past) | Overvalued Markets (Present) | Opportunities for Gold (Future)

